Fig. 6
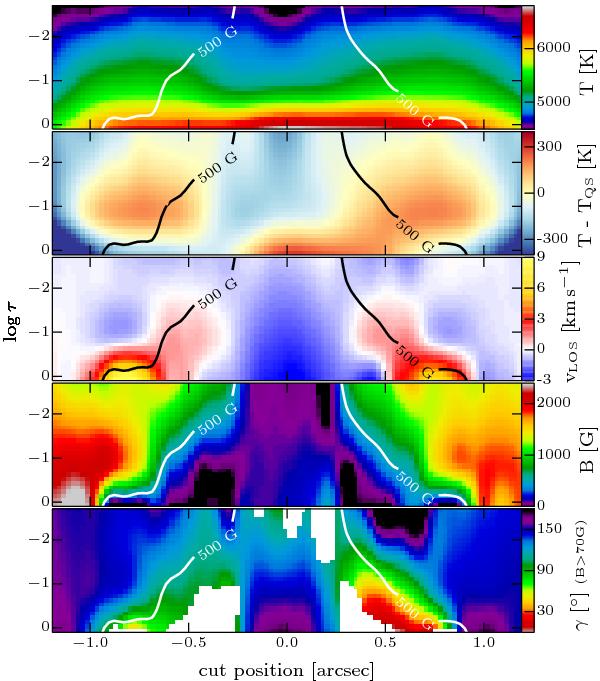
Vertical cut through a LBG (see cut (C1) in Fig. 1). From top to bottom (panels 1 to 5): temperature, temperature difference to an average quiet-Sun atmosphere, LOS velocity, magnetic field strength, and magnetic field inclination. The inclination is only shown for field strengths greater than 70 G. A 500 G contour line is overplotted.
Current usage metrics show cumulative count of Article Views (full-text article views including HTML views, PDF and ePub downloads, according to the available data) and Abstracts Views on Vision4Press platform.
Data correspond to usage on the plateform after 2015. The current usage metrics is available 48-96 hours after online publication and is updated daily on week days.
Initial download of the metrics may take a while.