Fig. 5
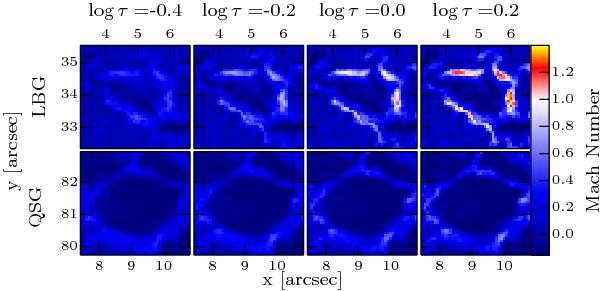
Mach number M determined from the LOS velocity and the thermodynamic parameters retrieved from the inversion for the LBG (top row, see Fig. 2) and a QSG (bottom row, see Fig. 4). The maps only show the very deep photospheric layers from log τ = −0.4 (left) to log τ = + 0.2 (right). Supersonic velocities are indicated by red/yellow colors, subsonic velocities by blue colors. Negative values denote the Mach number for upflows.
Current usage metrics show cumulative count of Article Views (full-text article views including HTML views, PDF and ePub downloads, according to the available data) and Abstracts Views on Vision4Press platform.
Data correspond to usage on the plateform after 2015. The current usage metrics is available 48-96 hours after online publication and is updated daily on week days.
Initial download of the metrics may take a while.