Fig. B.2
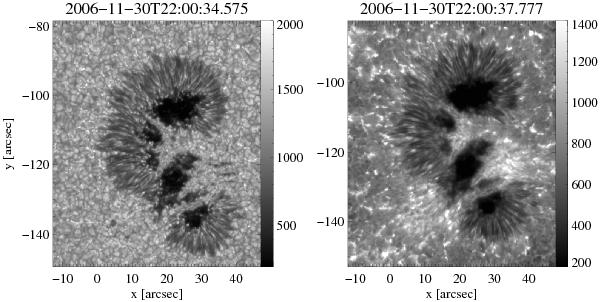
BFI images of the G-band (left) and in the Ca ii h line (right) around the time of the SOT/SP scan discussed in the paper (Fig. 1). In the animation, the exact time of the SOT/SP scan is indicated by the red text label in the upper lefthand corner. The movie demonstrates the absence of enhanced chromospheric activity above the LBGs during the time of the SOT/SP scan. (Online movie.)
Current usage metrics show cumulative count of Article Views (full-text article views including HTML views, PDF and ePub downloads, according to the available data) and Abstracts Views on Vision4Press platform.
Data correspond to usage on the plateform after 2015. The current usage metrics is available 48-96 hours after online publication and is updated daily on week days.
Initial download of the metrics may take a while.