Fig. B.1
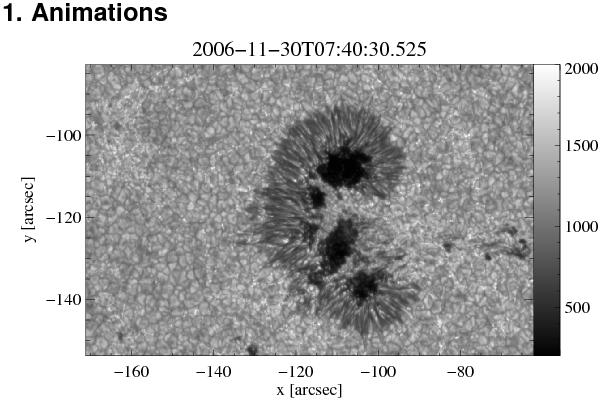
G-band images demonstrating the long-term stability of the LBGs under investigation in this paper. The animation, composed from G-band images of the Hinode SOT Broad-band Filter Imager (BFI), covers the time period from 2006-Nov.-30, 07:40 UT until 2006-Dec.-03, 23:59 UT. The same granular light bridges are present from the beginning of the observations until the end. (Online movie.)
Current usage metrics show cumulative count of Article Views (full-text article views including HTML views, PDF and ePub downloads, according to the available data) and Abstracts Views on Vision4Press platform.
Data correspond to usage on the plateform after 2015. The current usage metrics is available 48-96 hours after online publication and is updated daily on week days.
Initial download of the metrics may take a while.