Fig. 1
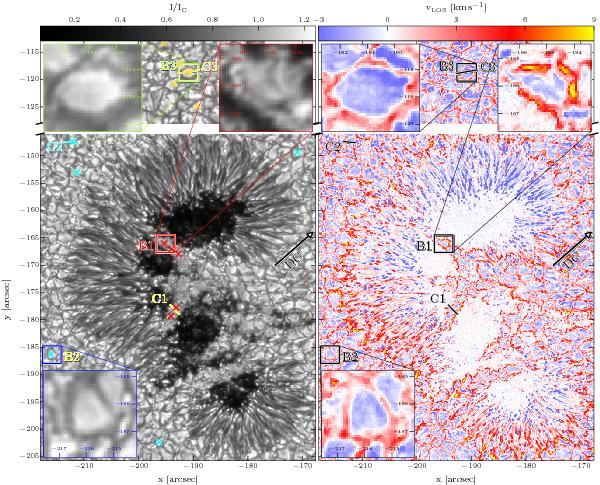
Continuum map of AR10926 composed from the fitted Stokes I profiles (left) and LOS velocity map at log τ = 0.0 (right). Positive values (red/yellow colors) denote downflows. The direction toward the disk center (DC) is indicated by the black arrow. The boxes (B1), (B2), and (B3), and the lines (C1) (in the center), (C2) (top left), and (C3) (top center) correspond to regions analyzed in Sect. 4. The red, cyan, and yellow crosses in the continuum image mark the granules used to determine the average atmospheric parameters in Table 1 for LBGs, PlGs, and QSGs, respectively.
Current usage metrics show cumulative count of Article Views (full-text article views including HTML views, PDF and ePub downloads, according to the available data) and Abstracts Views on Vision4Press platform.
Data correspond to usage on the plateform after 2015. The current usage metrics is available 48-96 hours after online publication and is updated daily on week days.
Initial download of the metrics may take a while.