Free Access
Fig. 8
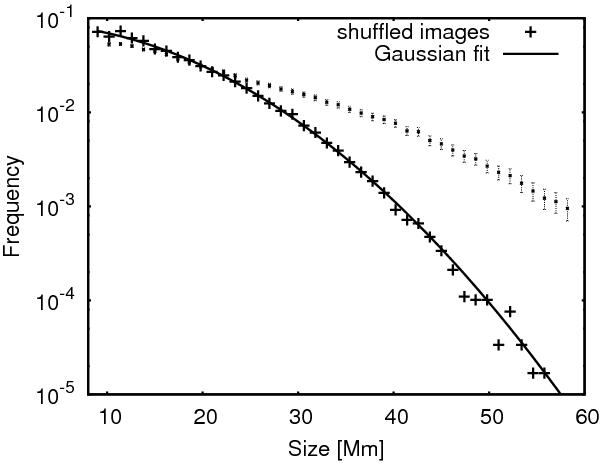
Symbols with error bars represent the void size distribution of 252 488 voids (as in Fig. 4) in semilog scale. Crosses show the mean VSD computed by shuffling the magnetic structures in each magnetogram. The Gaussian fit is represented by the continuous curve.
Current usage metrics show cumulative count of Article Views (full-text article views including HTML views, PDF and ePub downloads, according to the available data) and Abstracts Views on Vision4Press platform.
Data correspond to usage on the plateform after 2015. The current usage metrics is available 48-96 hours after online publication and is updated daily on week days.
Initial download of the metrics may take a while.