Fig. 5
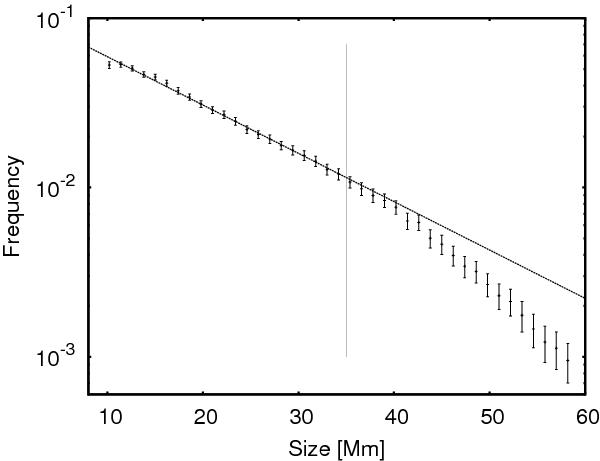
Symbols with error bars represent the VSD of 252 488 voids in semilog scale. Exponential fits in the regions 10–35 Mm and 35–60 Mm are represented by dotted lines. In the range 35–60 Mm the decay constant is Sd = 7.6 ± 0.2 Mm, while in the range 10–35 Mm the value is Sd = 12.4 ± 0.2 Mm. The continuous vertical line marks the 35 Mm scale.
Current usage metrics show cumulative count of Article Views (full-text article views including HTML views, PDF and ePub downloads, according to the available data) and Abstracts Views on Vision4Press platform.
Data correspond to usage on the plateform after 2015. The current usage metrics is available 48-96 hours after online publication and is updated daily on week days.
Initial download of the metrics may take a while.