Free Access
Fig. 4
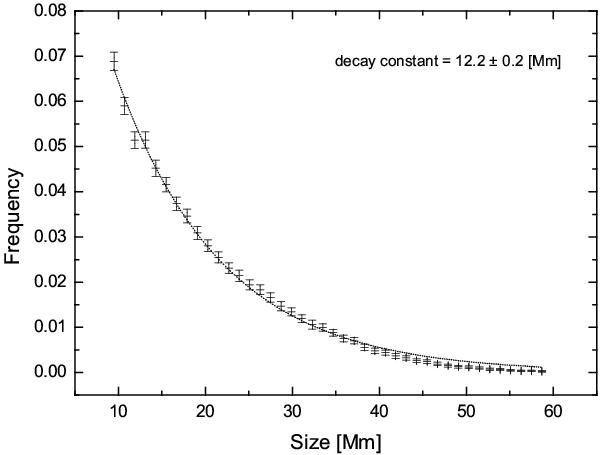
VSD of 252 488 voids singled out in the whole SOHO/MDI dataset. Error bars are computed via a 1000-samples bootstrap on 511 magnetograms. The dotted line represents the exponential decay fit, whose parameters are shown in the upper right corner.
Current usage metrics show cumulative count of Article Views (full-text article views including HTML views, PDF and ePub downloads, according to the available data) and Abstracts Views on Vision4Press platform.
Data correspond to usage on the plateform after 2015. The current usage metrics is available 48-96 hours after online publication and is updated daily on week days.
Initial download of the metrics may take a while.