Fig. 3
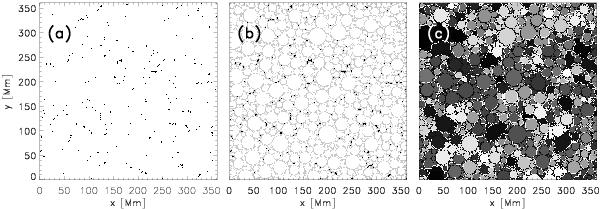
Panel a) detected magnetic structures (in black) on a typical binarized SOHO/MDI magnetogram. The threshold is equal to 3σ. Panel b) circles obtained by recursively defining the local DF maxima. Panel c) circles packed together to generate the voids. All the circles pertaining to the same void structure are labeled with the same index, i.e., color (in this figure we highlight voids with a white boundary). The panels show a portion of the MDI FOV for the sake of visualization.
Current usage metrics show cumulative count of Article Views (full-text article views including HTML views, PDF and ePub downloads, according to the available data) and Abstracts Views on Vision4Press platform.
Data correspond to usage on the plateform after 2015. The current usage metrics is available 48-96 hours after online publication and is updated daily on week days.
Initial download of the metrics may take a while.