Free Access
Fig. 1
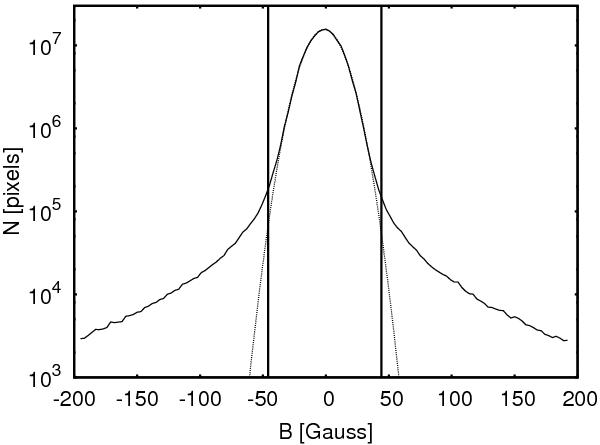
Magnetic flux density signal from the whole dataset. The Gaussian fit highlights the noise character of the distribution core. The vertical continuous lines mark the 3σ interval.
Current usage metrics show cumulative count of Article Views (full-text article views including HTML views, PDF and ePub downloads, according to the available data) and Abstracts Views on Vision4Press platform.
Data correspond to usage on the plateform after 2015. The current usage metrics is available 48-96 hours after online publication and is updated daily on week days.
Initial download of the metrics may take a while.