Fig. 15
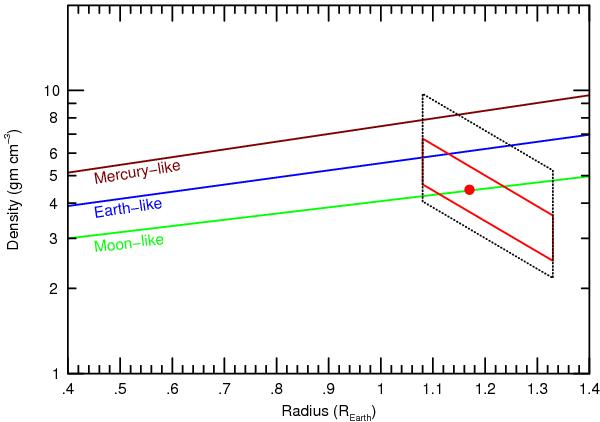
Density–radius relationships for terrestrial planets having a structure that is Mercury-like (top curve), Earth-like (middle curve) or Moon-like (bottom curve). The large dashed parallelogram marks roughly the range of values from the various mass determinations for Kepler-78b. The point marks are adopted solution and the error (solid parallelogram).
Current usage metrics show cumulative count of Article Views (full-text article views including HTML views, PDF and ePub downloads, according to the available data) and Abstracts Views on Vision4Press platform.
Data correspond to usage on the plateform after 2015. The current usage metrics is available 48-96 hours after online publication and is updated daily on week days.
Initial download of the metrics may take a while.