Fig. 12
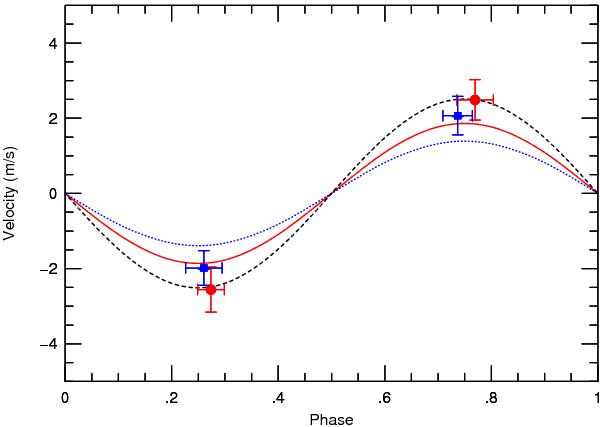
Phase-binned averages of the orbital variations of Kepler-78b at phases 0.25 and 0.75, the extrema of the orbital motion. The circles represents values using data from nights were only two RV measurements were made. The squares represent binned averages from nights where typically 6–10 measurements were made. The solid curve represents the orbital solution to the full HARPS-N data set. The dotted line represents the fit using a subset of the HARPS-N measurements where more than two RV measurements on a night were taken. The long-dashed line represents the best fit sine curve with amplitude K = 2.5 m s-1 that passes through the RV extrema represented by the circles.
Current usage metrics show cumulative count of Article Views (full-text article views including HTML views, PDF and ePub downloads, according to the available data) and Abstracts Views on Vision4Press platform.
Data correspond to usage on the plateform after 2015. The current usage metrics is available 48-96 hours after online publication and is updated daily on week days.
Initial download of the metrics may take a while.