Fig. 4
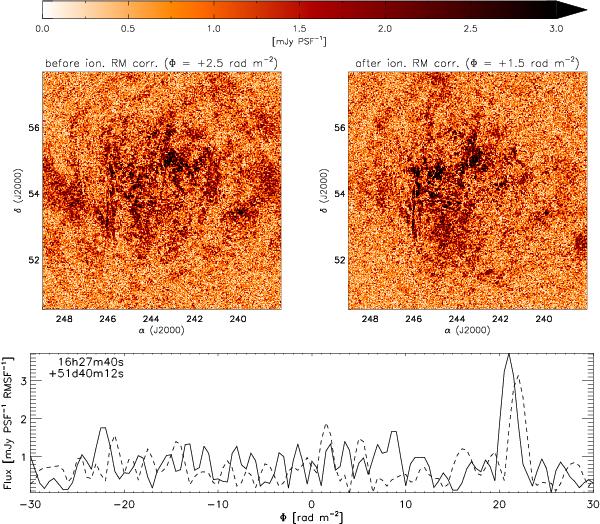
Effect of the ionospheric RM variation. Bottom plot shows the Faraday spectrum centred at the southwest lobe of the giant radio galaxy J162740+514012, before (dashed line) and after (solid line) applying the ionospheric RM correction. As expected, there is (i) a shift in Faraday spectrum that corresponds to an average of the ionospheric rotation measure; and (ii) an increase in the peak flux by 20%. The ionospheric RM variation also has an effect on the diffuse polarized emission as shown in the two images in the upper part of the figure. Note that these images are given at Faraday depths separated by an average of the ionospheric rotation measure to correct for a shift due to Faraday rotation in the ionosphere.
Current usage metrics show cumulative count of Article Views (full-text article views including HTML views, PDF and ePub downloads, according to the available data) and Abstracts Views on Vision4Press platform.
Data correspond to usage on the plateform after 2015. The current usage metrics is available 48-96 hours after online publication and is updated daily on week days.
Initial download of the metrics may take a while.