Fig. 9
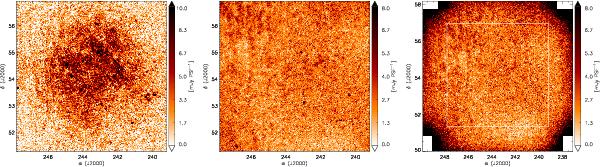
Total polarized intensity image of the ELAIS-N1 region integrated along Faraday depth at 160 MHz (observed with a single LOFAR pointing; left panel) and at 350 MHz (observed with the 28 WSRT mosaic pointings; right panel). A region observed with the LOFAR is smaller than a region observed with the WSRT. Hence, the image at 160 MHz measures 5.7° × 5.7° in size and the image at 350 MHz measures 8.2° × 8.2° in size. The white box marks a common region of the two images. A middle panel shows a part of the WSRT image within the white box. A PSF is 3.4′ × 3.1′ at 160 MHz and 2′ × 3′ at 350 MHz. A flux of 1 mJy PSF-1 corresponds to a brightness temperature of 0.46 K at 350 MHz, respectively 1.3 K at 160 MHz. The strongest emission in the WSRT 350 MHz image occurs in the northeastern part. Unfortunately the size of the LOFAR station beam at 160 MHz prevents us from detecting any corresponding emission at 150 MHz.
Current usage metrics show cumulative count of Article Views (full-text article views including HTML views, PDF and ePub downloads, according to the available data) and Abstracts Views on Vision4Press platform.
Data correspond to usage on the plateform after 2015. The current usage metrics is available 48-96 hours after online publication and is updated daily on week days.
Initial download of the metrics may take a while.