Fig. 6
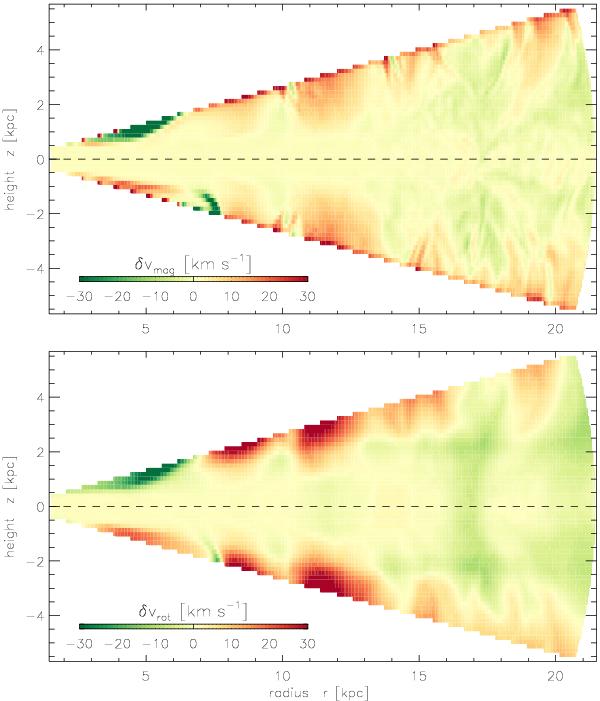
Results from a dynamical dynamo simulation including mean-field effects. Colour-coded lag in the rotation velocity vφ(r,z) averaged over azimuth. Values | δv | > 30 km s-1have been clipped for clarity. Top: Predicted deviation from the initial rotation profile based on the effect of the Lorentz force. Bottom: the actual deviation seen in the simulation, which appears more washed out owing to the effect of the turbulent viscosity but otherwise agrees markedly well (see also the lower panel of Fig. 9 in Gressel et al. 2013, for the actual field distribution).
Current usage metrics show cumulative count of Article Views (full-text article views including HTML views, PDF and ePub downloads, according to the available data) and Abstracts Views on Vision4Press platform.
Data correspond to usage on the plateform after 2015. The current usage metrics is available 48-96 hours after online publication and is updated daily on week days.
Initial download of the metrics may take a while.