Fig. 3
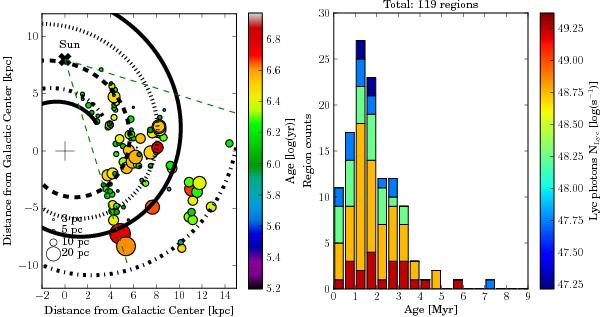
Left: diameter, age, and position of the H ii regions of the HRDS survey in the Galaxy. The dashed green lines show the limit of the survey, the thick black curves are the position of the spiral arms of our Galaxy based on Russeil (2003). The ages are estimated using the grid of 1D simulations at a fixed density at 1 pc (3400 cm-3) for the initial profile. The galactic electron temperature gradient is taken into account using Eq. (8). Right: age distribution of our sample, the ionizing flux of the regions is indicated by the colour scale.
Current usage metrics show cumulative count of Article Views (full-text article views including HTML views, PDF and ePub downloads, according to the available data) and Abstracts Views on Vision4Press platform.
Data correspond to usage on the plateform after 2015. The current usage metrics is available 48-96 hours after online publication and is updated daily on week days.
Initial download of the metrics may take a while.