Fig. 2
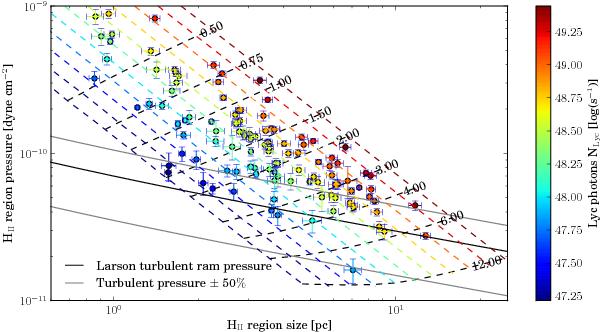
Pressure of the H ii regions of the HRDS survey as a function of radius. The black line is the turbulent ram pressure evaluated from Larson’s laws at the scale of the radius of the region (Eq. (11)). The grey lines show the limits at ± 50% of this relation. The dashed coloured lines are 1D simulations performed in a density and temperature profile based on Larson’s laws at different Lyc fluxes given by the colour bar. The dashed black lines are isochrones (in Myr) built from these simulations, they are used to estimate the age of the H ii regions. To avoid a 3D plot, we assume an constant electron temperature of 8000 K for all of the regions and simulations (only for this plot).
Current usage metrics show cumulative count of Article Views (full-text article views including HTML views, PDF and ePub downloads, according to the available data) and Abstracts Views on Vision4Press platform.
Data correspond to usage on the plateform after 2015. The current usage metrics is available 48-96 hours after online publication and is updated daily on week days.
Initial download of the metrics may take a while.