Fig. 1
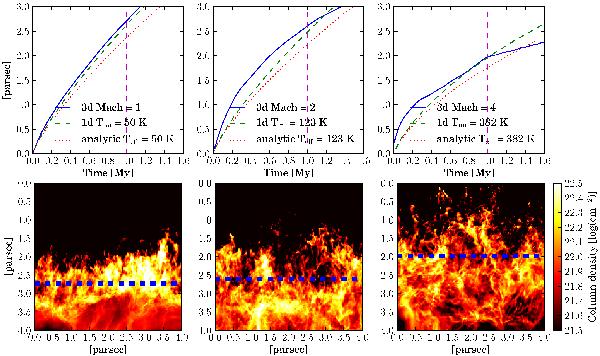
Top: position (relative to the top of the box) of the mean ionization front as a function of time for the 3D turbulent simulations (at Mach 1, 2, and 4 in solid blue) of Tremblin et al. (2012) and the corresponding analytical solutions (dotted red) and 1D simulations (dashed green) in which the turbulence is taken into account by an effective temperature/sound speed. Bottom: snapshots of the column density of the 3D simulations at a time of 1 Myr after the ionization is switched on at the top of the box. The blue-dashed lines show the mean position of the ionization front.
Current usage metrics show cumulative count of Article Views (full-text article views including HTML views, PDF and ePub downloads, according to the available data) and Abstracts Views on Vision4Press platform.
Data correspond to usage on the plateform after 2015. The current usage metrics is available 48-96 hours after online publication and is updated daily on week days.
Initial download of the metrics may take a while.