Fig. 9
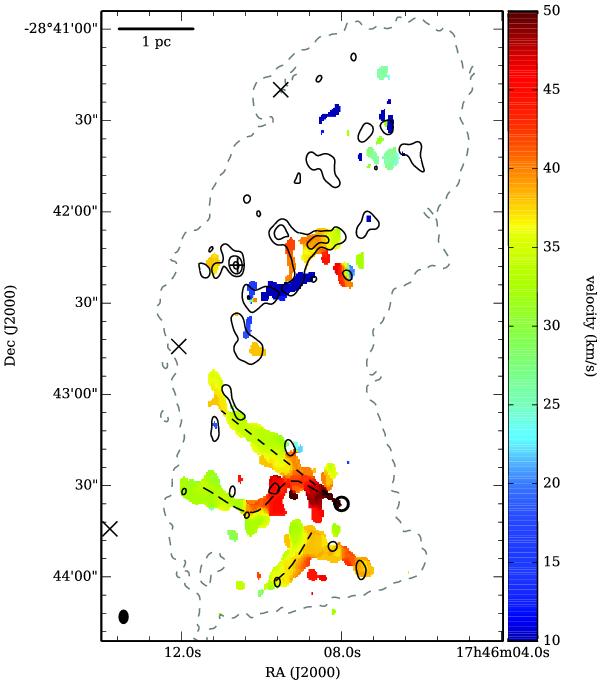
First moment map of the 4(2, 2)–3(1, 2)-E methanol line at 218.440 GHz. Black contours show the 230.9 GHz or 1.30 mm continuum emission observed with the SMA at 5, 10 and 20× rms noise = 2.5 mJy beam-1. The synthesised beam for the methanol line is shown in the bottom left corner: 4.3′′ × 2.9′′, PA = –1.1°. The plus sign marks the position of the water maser reported by Lis et al. (1994) and the crosses mark (from north to south, respectively) the positions of the 1.3 cm sources VLA 4 to 6 from Rodríguez & Zapata (2013). The thick black circle in the south of the image marks the position of point A and the dashed lines show the positions of the three filaments mentioned in the text. The dashed grey contour shows the combined dust continuum emission at a level of 0.024 mJy beam-1, the lowest black contour shown in Fig. 4.
Current usage metrics show cumulative count of Article Views (full-text article views including HTML views, PDF and ePub downloads, according to the available data) and Abstracts Views on Vision4Press platform.
Data correspond to usage on the plateform after 2015. The current usage metrics is available 48-96 hours after online publication and is updated daily on week days.
Initial download of the metrics may take a while.