Fig. 6
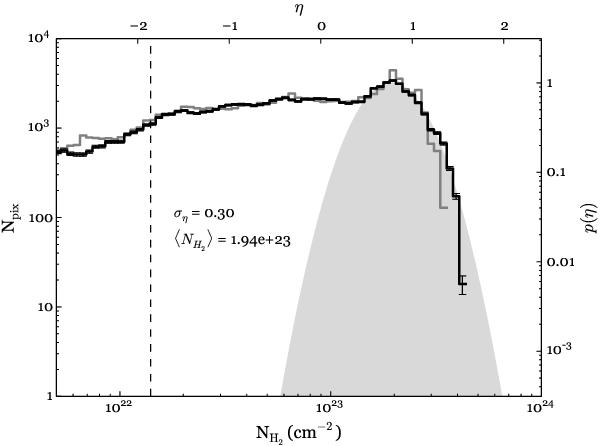
Probability distribution functions (PDFs) of the column density for G0.253+0.016, assuming a value of β = 1.75. The black line shows the PDF for the combined image (4.3′′ × 2.7′′ resolution, or 0.18 × 0.11 pc for d = 8.4 kpc), and the grey line the SCUBA-only PDF (8′′ or 0.33 pc resolution). The left y-axis shows the number of pixels per logarithmic bin Npix, and the right y-axis is the normalised probability p(η). The top x-axis is displays the dimensionless parameter η = ln(N/ ⟨ N ⟩). The dashed line shows the column density corresponding to the 3σ noise level, assuming a temperature of 30 K. The Poisson errors are shown as error bars. The grey filled area corresponds to a by-eye fit to the combined PDF, giving the fit parameters ση, describing the PDF width, and ⟨ NH2 ⟩, the average density, whose values are shown in the figure.
Current usage metrics show cumulative count of Article Views (full-text article views including HTML views, PDF and ePub downloads, according to the available data) and Abstracts Views on Vision4Press platform.
Data correspond to usage on the plateform after 2015. The current usage metrics is available 48-96 hours after online publication and is updated daily on week days.
Initial download of the metrics may take a while.