Fig. 5
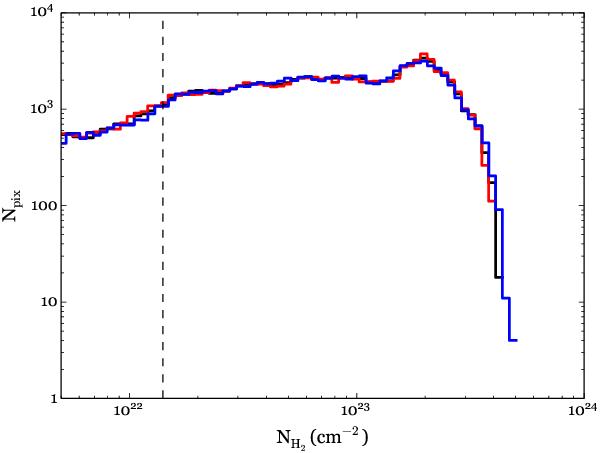
Probability distribution functions (PDFs) of column density for G0.253+0.016, assuming three values of β when scaling the SCUBA 450 μm emission: 1.5, 1.75 and 2.0 (red, black, and blue, respectively). The density-values in the PDF shown for β = 1.5 and 2.0 have been multiplied by factors of 0.87 and 1/0.87, respectively. The PDFs are derived from images with a resolution of 4.3′′ × 2.7′′, or 0.18 × 0.11 pc at a distance of 8.4 kpc. The y-axis shows the number of pixels Npix per logarithmic bin. The dashed line shows the column density corresponding to the 3σ noise level for the β = 1.75 image, assuming a temperature for the outer regions of the cloud of 30 K.
Current usage metrics show cumulative count of Article Views (full-text article views including HTML views, PDF and ePub downloads, according to the available data) and Abstracts Views on Vision4Press platform.
Data correspond to usage on the plateform after 2015. The current usage metrics is available 48-96 hours after online publication and is updated daily on week days.
Initial download of the metrics may take a while.