Fig. 4
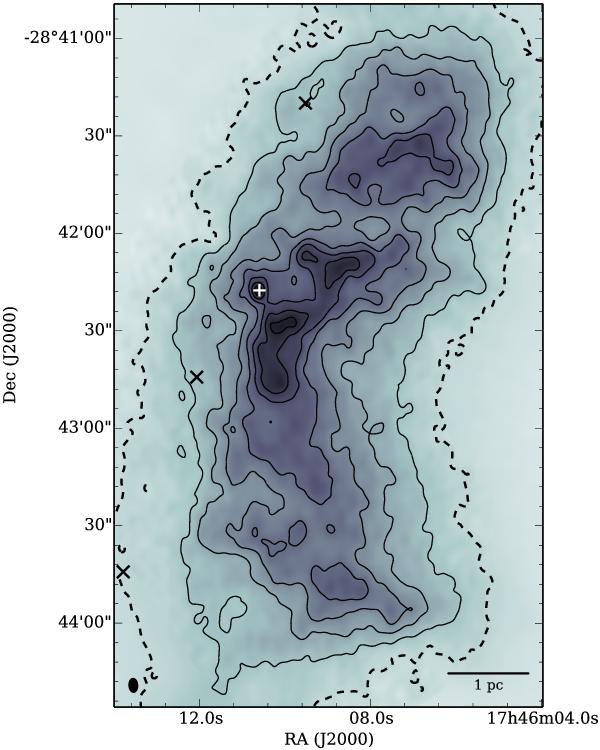
Map of the 230.9 GHz or 1.3 mm continuum emission observed with the SMA, combined with the scaled single-dish SCUBA 1.3 mm emission derived in Sect. 2.3. Contours are –6, 6, 10, 14, 18, 22, 26 and 30 × 4 mJy beam-1. Greyscale: –20 to 150 mJy beam-1. The synthesised beam is the same as the SMA-only image, and is shown in the bottom left corner: 4.3′′ × 2.7′′, PA = 4.0°. The plus sign marks the position of the water maser reported by Lis et al. (1994) and the crosses mark (from north to south, respectively) the positions of the 1.3 cm sources VLA 4 to 6 from Rodríguez & Zapata (2013). The dashed black contour shows a column density of 2 × 1022 cm-2 for β = 1.75, used as the outer boundary of the cloud when determining its total mass.
Current usage metrics show cumulative count of Article Views (full-text article views including HTML views, PDF and ePub downloads, according to the available data) and Abstracts Views on Vision4Press platform.
Data correspond to usage on the plateform after 2015. The current usage metrics is available 48-96 hours after online publication and is updated daily on week days.
Initial download of the metrics may take a while.