Fig. 3
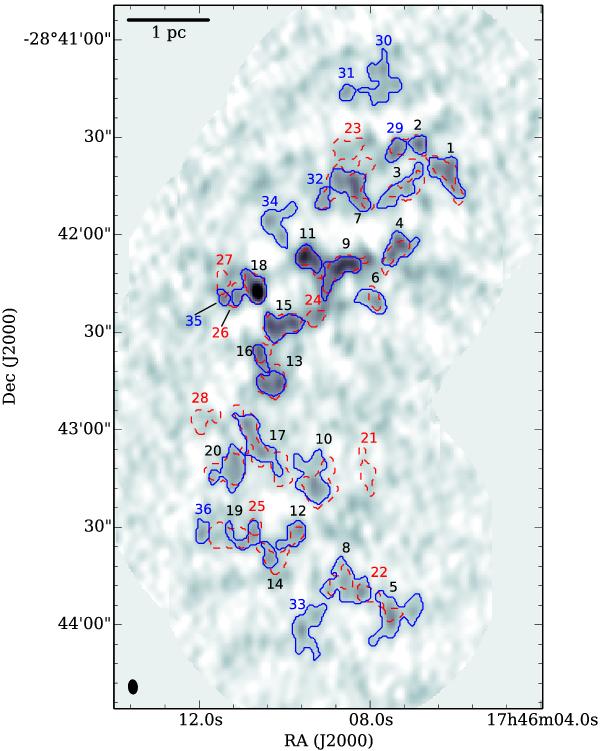
Map of the cores detected in 218.9 and 230.9 GHz (1.37 mm and 1.30 mm) continuum emission observed with the SMA, in red dashed and blue solid contours, respectively. The 1.30 mm continuum emission is shown in greyscale, ranging between –2.5 and 40 mJy beam-1. The cores are numbered as listed in Table 2. The synthesised beam is shown in the bottom left corner: 4.3′′ × 2.7′′, PA = 4.0°.
Current usage metrics show cumulative count of Article Views (full-text article views including HTML views, PDF and ePub downloads, according to the available data) and Abstracts Views on Vision4Press platform.
Data correspond to usage on the plateform after 2015. The current usage metrics is available 48-96 hours after online publication and is updated daily on week days.
Initial download of the metrics may take a while.