Fig. 18
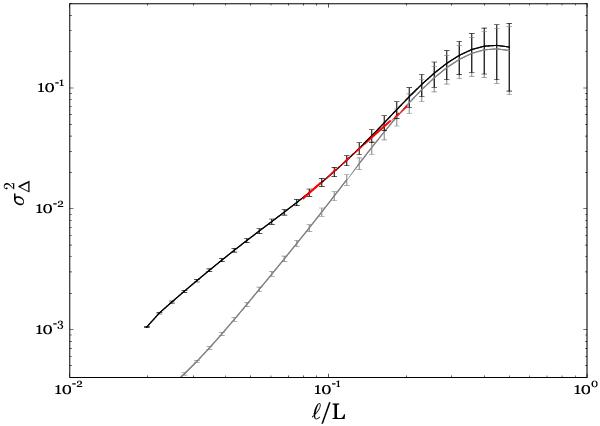
Δ-variance spectrum of G0.253+0.016 as a function of the fractional length scale ℓ/L, calculated from the column densities derived from the SCUBA-only image (grey line), and from the combined SMA plus SCUBA image (black line). The displayed errors are calculated via the method outlined in Bensch et al. (2001). The red line shows the best fit to the combined SMA plus SCUBA Δ-variance between 0.08 and 0.2, giving a slope 1.907 ± 0.037 corresponding to α = − 1.907 ± 0.037.
Current usage metrics show cumulative count of Article Views (full-text article views including HTML views, PDF and ePub downloads, according to the available data) and Abstracts Views on Vision4Press platform.
Data correspond to usage on the plateform after 2015. The current usage metrics is available 48-96 hours after online publication and is updated daily on week days.
Initial download of the metrics may take a while.