Fig. 17
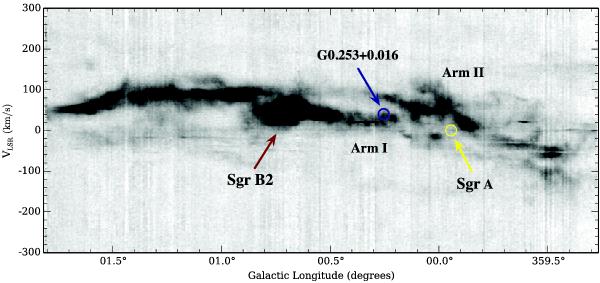
Galactic longitude–velocity diagram of the CMZ in HNC, using the 3 mm line data presented in Jones et al. (2012). To make the ℓ–v diagram, the emission was integrated between Galactic latitudes b = − 0.29 and 0.21. The approximate positions and velocities of G0.253+0.016, Sgr A and Sgr B2 are shown, and Arms I and II from Sofue (1995) are labelled.
Current usage metrics show cumulative count of Article Views (full-text article views including HTML views, PDF and ePub downloads, according to the available data) and Abstracts Views on Vision4Press platform.
Data correspond to usage on the plateform after 2015. The current usage metrics is available 48-96 hours after online publication and is updated daily on week days.
Initial download of the metrics may take a while.