Free Access
Fig. 16
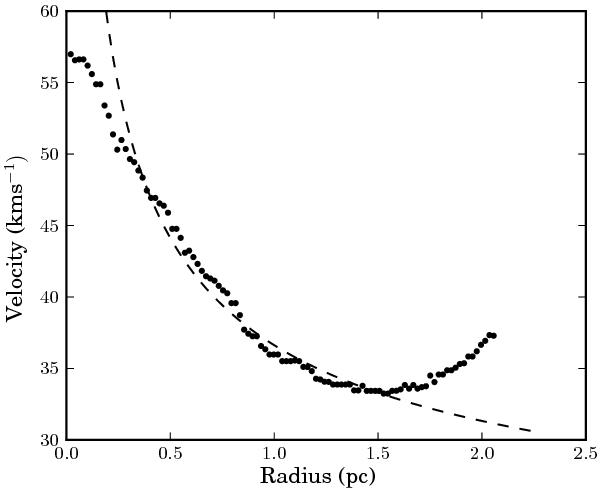
Filled circles show a position–velocity cut along the northmost filament shown in Fig. 9, between 17h46m08 0 -28°43′36.̋5 and 17h46m110 -28°43′05.̋4 (J2000). The dashed line presents a fit to the data between radii of 0.25 and 1.5 pc (assuming a distance of 8.4 kpc).
Current usage metrics show cumulative count of Article Views (full-text article views including HTML views, PDF and ePub downloads, according to the available data) and Abstracts Views on Vision4Press platform.
Data correspond to usage on the plateform after 2015. The current usage metrics is available 48-96 hours after online publication and is updated daily on week days.
Initial download of the metrics may take a while.