Fig. 11
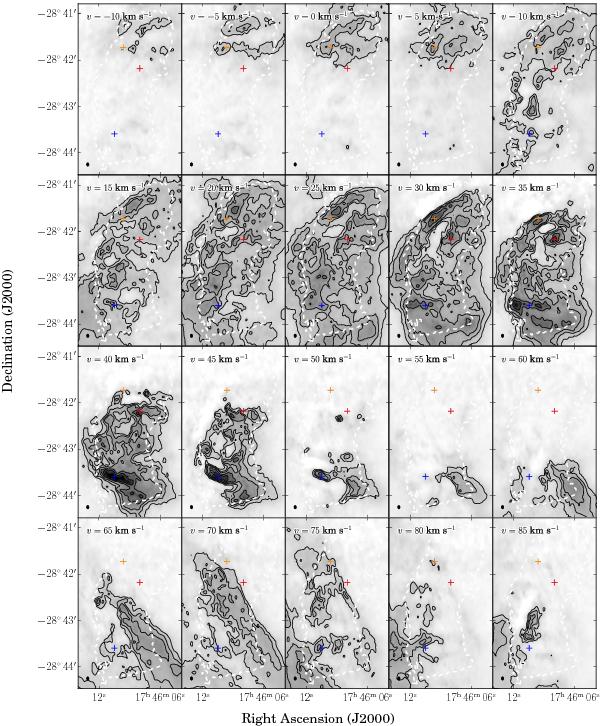
Combined SMA + IRAM 30 m 13CO emission between –10 and 85 km s-1. Contours are 10, 15, 20, 30 and 40× the map sensitivity 0.14 mJy beam-1, for a spectral resolution of 5 km s-1. The greyscale ranges from –0.14 to 8 mJy beam-1. The beam size of 4.2′′× 2.9′′, PA = 0.7° is shown in the bottom left corner, which corresponds to the size of the SMA beam. The dashed white contour shows the combined 1.3 mm dust continuum emission at a level of 0.024 mJy beam-1, the lowest black contour shown in Fig. 4. The coloured crosses correspond to the positions of the spectra shown in Fig. 12.
Current usage metrics show cumulative count of Article Views (full-text article views including HTML views, PDF and ePub downloads, according to the available data) and Abstracts Views on Vision4Press platform.
Data correspond to usage on the plateform after 2015. The current usage metrics is available 48-96 hours after online publication and is updated daily on week days.
Initial download of the metrics may take a while.