Fig. 10
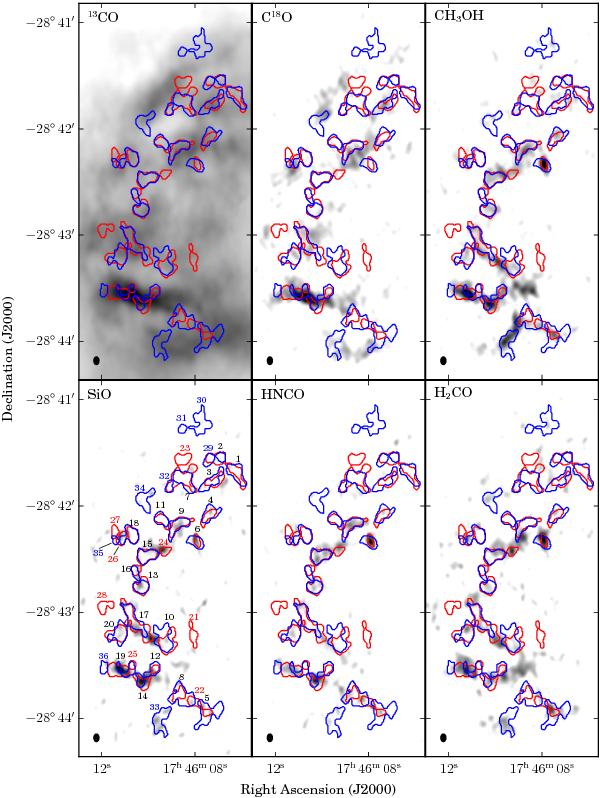
Comparison between dust continuum and line emission integrated between 0 and 60 km s-1. The red and blue contours show the positions of the cores detected in SMA dust continuum (blue and red for 1.3 and 1.37 mm respectively, see Fig. 3). A representative synthesised beam of 4.3′′ × 2.9′′, PA = 0° is shown in the bottom left corner. The greyscale shows the SMA line emission (combined with IRAM 30 m in the case of 13CO) integrated between 0 and 60 km s-1 for six lines: 13CO, C18O, CH3OH 4(2, 2)–3(1, 2)-E, SiO, HNCO and H2CO 3(0, 3)–2(0, 2). The lines are shown with stretches 5–10 mJy beam-1 km s-1 for 13CO, 3–14 mJy beam-1 km s-1 for C18O and CH3OH, and 3–10 mJy beam-1 km s-1 for the remaining lines.
Current usage metrics show cumulative count of Article Views (full-text article views including HTML views, PDF and ePub downloads, according to the available data) and Abstracts Views on Vision4Press platform.
Data correspond to usage on the plateform after 2015. The current usage metrics is available 48-96 hours after online publication and is updated daily on week days.
Initial download of the metrics may take a while.