Fig. 9
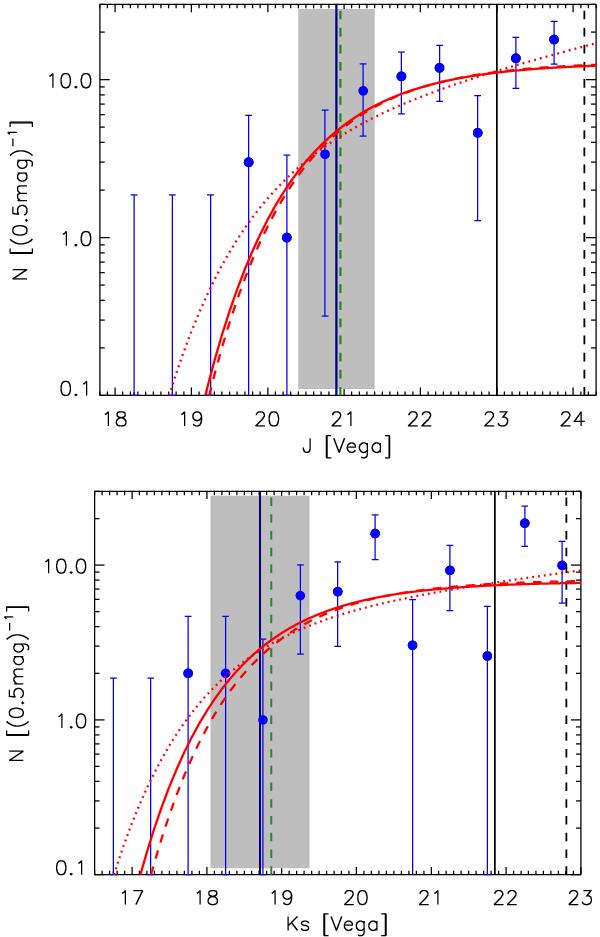
Observed galaxy luminosity functions (blue data points) in the J- (top) and Ks-band (bottom) for XDCP J0044.0-2033 extracted within a cluster-centric radius of 30′′ (≃250 kpc). The red lines show the best fit Schechter functions for three (φ*, m*, α) free parameters (dotted), two free parameters with a fixed faint end slope of α = − 1 (solid), and a single parameter normalization fit (dashed) using a SSP model magnitude for m* (green dashed vertical line). The dark blue vertical line with the grey shaded area indicates the best fit solution of the characteristic magnitude m* of the two parameter fit with 1σ uncertainties. The vertical black (dashed) solid lines on the right indicate the 100% (50%) completeness limits.
Current usage metrics show cumulative count of Article Views (full-text article views including HTML views, PDF and ePub downloads, according to the available data) and Abstracts Views on Vision4Press platform.
Data correspond to usage on the plateform after 2015. The current usage metrics is available 48-96 hours after online publication and is updated daily on week days.
Initial download of the metrics may take a while.