Fig. 6
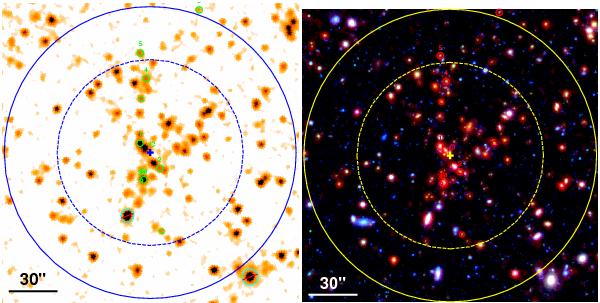
Left panel: Spitzer/IRAC 4.5 μm view of the cluster volume (3′× 3′). The cluster center (central cross), R500 (dashed blue circle), and R200 (solid blue circle) are indicated, small circles mark spectroscopic members as in Fig. 2. The crossed-out cyan objects were removed from the analysis. Right panel: color composite with the same FoV by adding the V-band (blue) and the combined J + Ks image (green) to the Spitzer 4.5 μm data (red).
Current usage metrics show cumulative count of Article Views (full-text article views including HTML views, PDF and ePub downloads, according to the available data) and Abstracts Views on Vision4Press platform.
Data correspond to usage on the plateform after 2015. The current usage metrics is available 48-96 hours after online publication and is updated daily on week days.
Initial download of the metrics may take a while.