Fig. 3
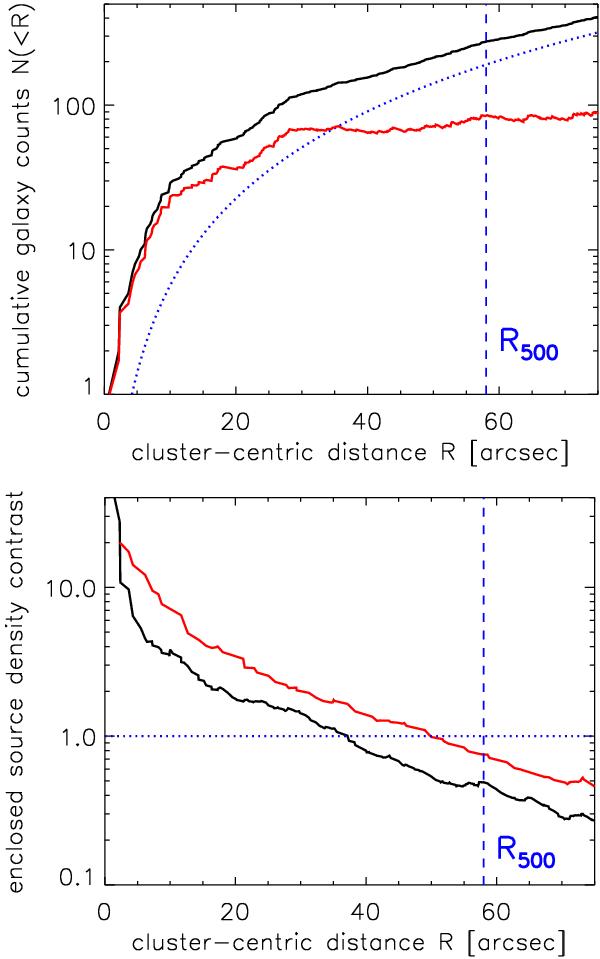
Enclosed galaxy count properties within the projected cluster-centric distance R from the X-ray centroid based on all HAWK-I detected sources. The dashed vertical line indicates the R500 radius of the cluster. Top panel: cumulative radial galaxy count profile N( <R) of enclosed sources within R for all galaxies (black solid line) and background-subtracted net cluster member counts (red line). The average background counts are shown by the blue dotted line. A total of about 90 excess galaxies associated with the cluster are detected. Bottom panel: enclosed galaxy density contrast ([ N( <R) − B( <R) ] /B( <R)) within radius R for all galaxies with 17 ≤ Ks ≤ 22 (black line) and brighter galaxies with 17 ≤ Ks ≤ 20 (top red line). At the intersection point with the horizontal dashed dotted line the enclosed cluster galaxy density equals the background density.
Current usage metrics show cumulative count of Article Views (full-text article views including HTML views, PDF and ePub downloads, according to the available data) and Abstracts Views on Vision4Press platform.
Data correspond to usage on the plateform after 2015. The current usage metrics is available 48-96 hours after online publication and is updated daily on week days.
Initial download of the metrics may take a while.