Fig. 18
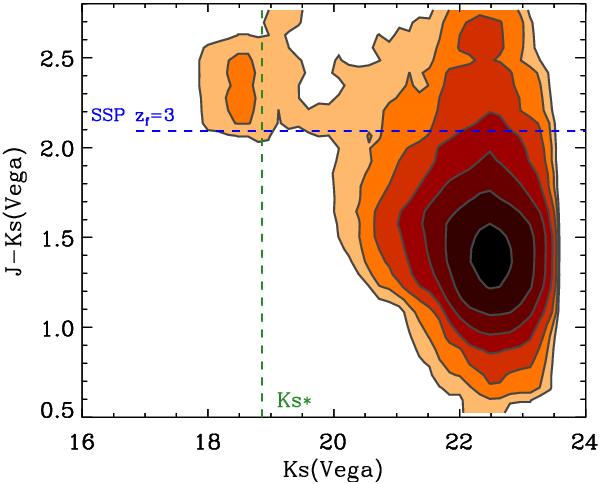
Predicted densities of galaxies at z ≃ 1.6 in the J − Ks versus Ks observer-frame CMD for cluster environments with M200 ≥ 2 × 10¹⁴ M⊙ based on the semi-analytic models of Menci et al. (2008). The different contours indicate an increase by factors of two in CMD density from light to dark colors. Dashed lines have the same meaning as in the observed version of the diagram shown in Fig. 13.
Current usage metrics show cumulative count of Article Views (full-text article views including HTML views, PDF and ePub downloads, according to the available data) and Abstracts Views on Vision4Press platform.
Data correspond to usage on the plateform after 2015. The current usage metrics is available 48-96 hours after online publication and is updated daily on week days.
Initial download of the metrics may take a while.