Fig. 16
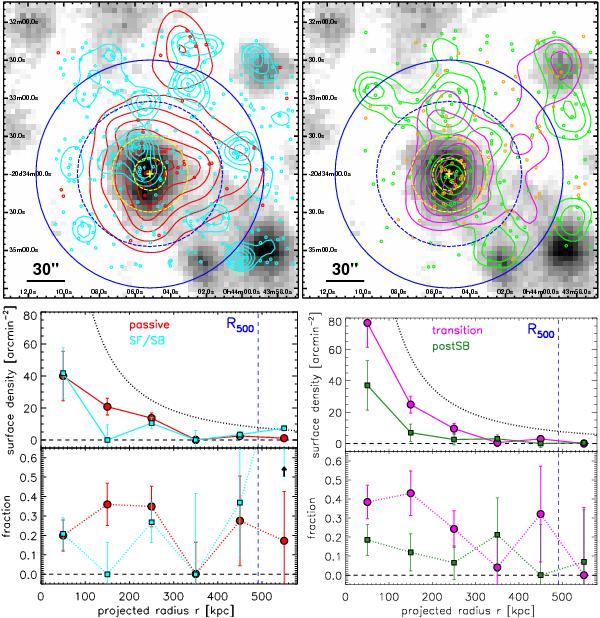
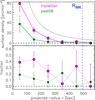
Top panels: spatial-excess distributions of color−color-selected galaxies overlaid on the gray-scale XMM-Newton X-ray image (3.9′× 3.9′). The blue circles indicate R200 (solid) and R500 (dashed), and the dashed yellow circles mark the 13′′/30′′ analysis radii about the X-ray centroid position (yellow cross). Top-left panel: logarithmically spaced density contours (red) of galaxies with colors consistent with a passive SSP SED (red circles) in J − Ks versus i − Ks color space and for objects with colors similar to the starburst template (cyan contours and circles). Top-right panel: same field showing the spatial distribution of red-sequence transition galaxies (magenta contours and orange circles) and galaxies with post-starburst colors (green contours and circles). Bottom panels: corresponding azimuthally averaged and background-subtracted surface-density profiles (upper half) and galaxy fractions (bottom half) as function of projected cluster-centric radius for the same four color−color selected galaxy types as above. The black dotted line indicates the total best-fit galaxy surface-density profile as derived in Fig. 4 as reference. The black upward arrow in the outermost bin of the starburst category (cyan) in the lower left panel marks the 1σ lower limit for this class.
Current usage metrics show cumulative count of Article Views (full-text article views including HTML views, PDF and ePub downloads, according to the available data) and Abstracts Views on Vision4Press platform.
Data correspond to usage on the plateform after 2015. The current usage metrics is available 48-96 hours after online publication and is updated daily on week days.
Initial download of the metrics may take a while.