Fig. 15
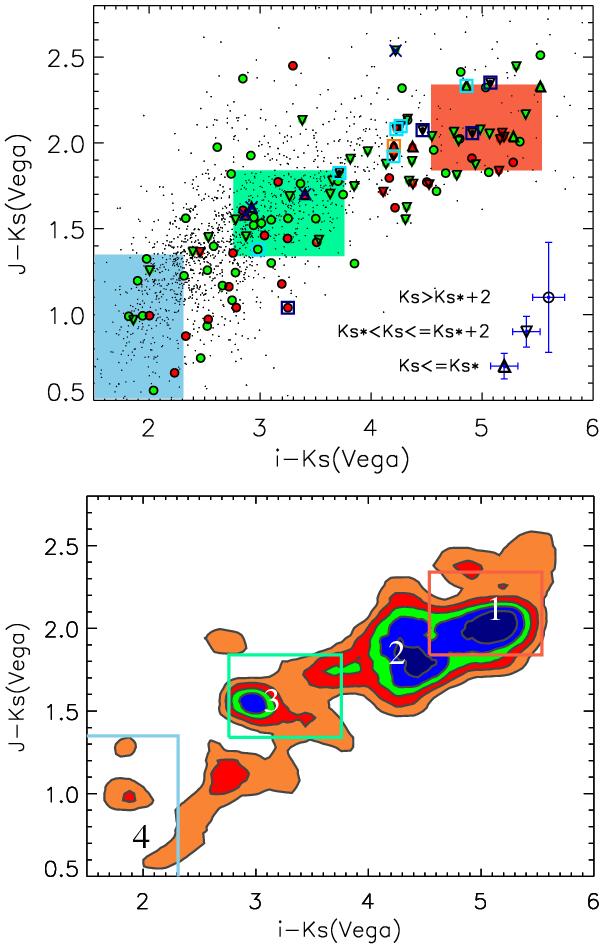
Top panel: observed J − Ks versus i − Ks color−color-diagram of the galaxies shown in Fig. 12 with the same color coding. The Ks magnitude of the galaxies is indicated by the outer shape: triangles for galaxies brighter than Ks* at z = 1.58, inverted triangles for magnitudes between Ks* and Ks* + 2, and circles for galaxies fainter than Ks* + 2. The median color errors for the three magnitude bins are shown in the legend in the lower right corner. The red, green, and blue boxes show the immediate color−color environment of galaxies with a SED consistent with the template spectra at the cluster redshift (Fig. 11) for a passive galaxy (red), a post-starburst template (green), and active starbursts (blue). Bottom panel: background-subtracted cluster galaxy densities in color−color space with density levels of 1 (orange), 2.2 (red), 3.4 (green), 4.6 (blue), 5.8 (dark blue) core cluster galaxies per arcmin2 per 0.4 mag in i − Ks per 0.2 mag in J − Ks. Numbers 1−4 mark the central positions for the color−color selection of different galaxy types with the intervals as specified in the text, while the boxes show the template colors as above: 1: passive, 2: transition objects, 3: post-starburst, 4: starburst/starforming.
Current usage metrics show cumulative count of Article Views (full-text article views including HTML views, PDF and ePub downloads, according to the available data) and Abstracts Views on Vision4Press platform.
Data correspond to usage on the plateform after 2015. The current usage metrics is available 48-96 hours after online publication and is updated daily on week days.
Initial download of the metrics may take a while.