Fig. 13
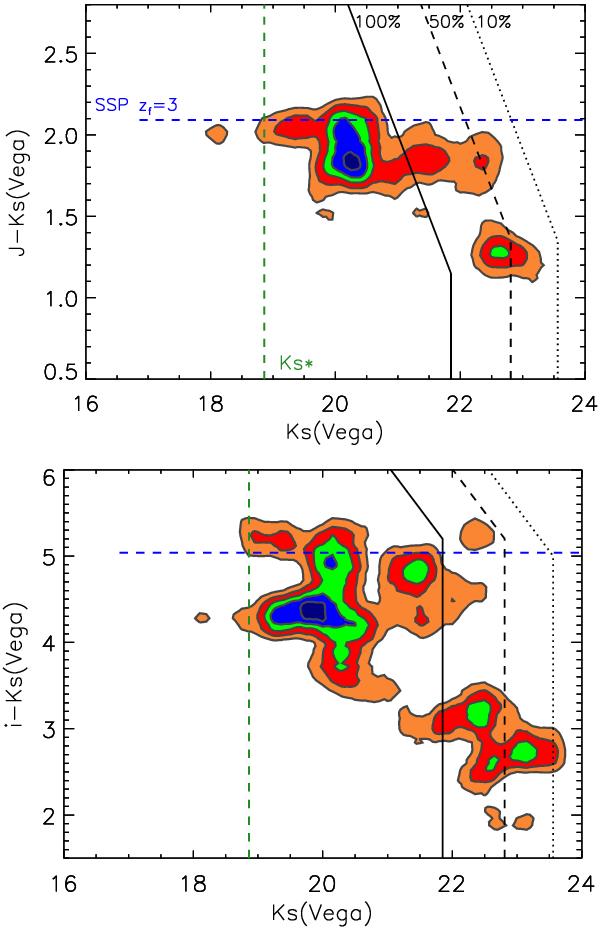
Background-subtracted densities of cluster galaxies of XDCP J0044.0-2033 in the J − Ks versus Ks (top) and i − Ks versus Ks (bottom) color magnitude diagrams based on the data shown in Fig. 12. The cluster region was constrained to a radius of 30′′ from the X-ray centroid. The contours and the corresponding filled regions correspond to detected cluster galaxy densities of 3 (orange), 5 (red), 7 (green), 9 (blue), 11 (dark blue) in units of galaxies per arcmin2 per mag in Ks per 0.2 mag in J − Ks for the top panel and densities of 2.3 (orange), 3.6 (red), 4.9 (green), 6.2 (blue), 7.5 (dark blue) galaxies per arcmin2 per mag in Ks per 0.4 mag in i − Ks for the bottom panel. The sharp truncation of the cluster red-sequence at Ks ~ 20.5 and the significant population of faint blue galaxies in the lower right corner are clearly visible. Lines have the same meaning as in Fig. 12.
Current usage metrics show cumulative count of Article Views (full-text article views including HTML views, PDF and ePub downloads, according to the available data) and Abstracts Views on Vision4Press platform.
Data correspond to usage on the plateform after 2015. The current usage metrics is available 48-96 hours after online publication and is updated daily on week days.
Initial download of the metrics may take a while.