Fig. 11
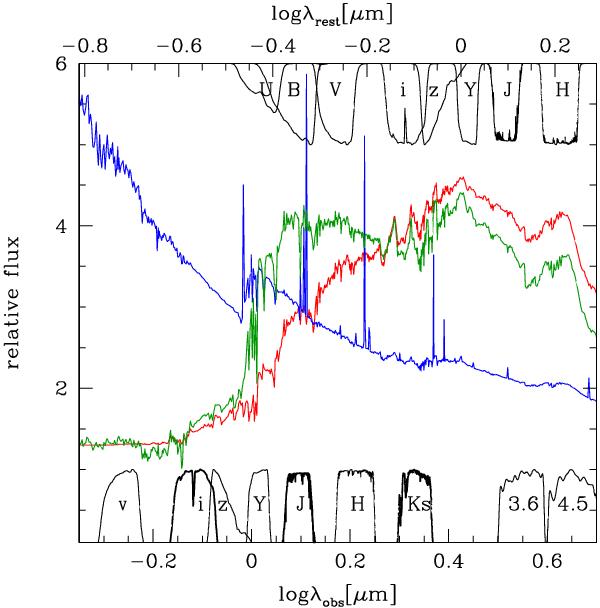
SED template spectra for an old elliptical galaxy (red), a post-starburst 1 Gyr after SF (green), and an active starburst (blue) redshifted to observed wavelengths at the cluster redshift of XDCP J0044.0-2033 (bottom axis) and in restframe units (top axis). The main filter transmission curves are plotted in black at the bottom of the panel with their names indicated. The corresponding restframe wavelength coverage is shown on top.
Current usage metrics show cumulative count of Article Views (full-text article views including HTML views, PDF and ePub downloads, according to the available data) and Abstracts Views on Vision4Press platform.
Data correspond to usage on the plateform after 2015. The current usage metrics is available 48-96 hours after online publication and is updated daily on week days.
Initial download of the metrics may take a while.