Fig. 1
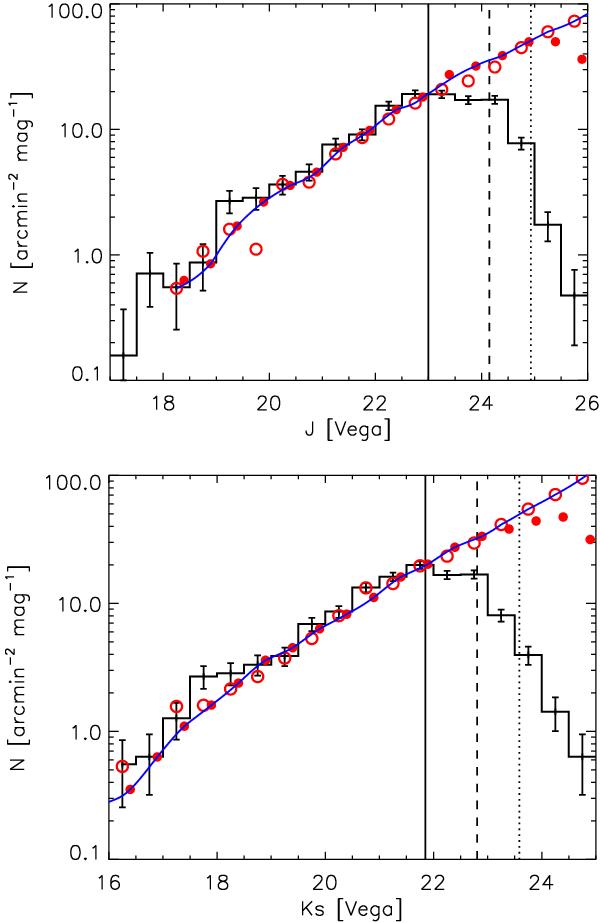
Differential galaxy number counts in the J (top panel) and Ks-band (bottom panel). The black histograms show the measured differential galaxy counts in the background regions with Poisson errors. Open circles show literature number counts taken from Maihara et al. (2001) while filled circles are counts from larger fields from Windhorst et al. (2011) in J and Galametz et al. (2013) in Ks. The solid lines show the combined reference counts used to determine the completeness levels as a function of magnitude. The 100%/50%/10% completeness levels are indicated by solid/dashed/dotted vertical lines. The slight excess in some bins can be attributed to the large-scale structure environment of XDCP J0044.0-2033 and the nearby cluster A2813 at z = 0.292.
Current usage metrics show cumulative count of Article Views (full-text article views including HTML views, PDF and ePub downloads, according to the available data) and Abstracts Views on Vision4Press platform.
Data correspond to usage on the plateform after 2015. The current usage metrics is available 48-96 hours after online publication and is updated daily on week days.
Initial download of the metrics may take a while.