Fig. 5
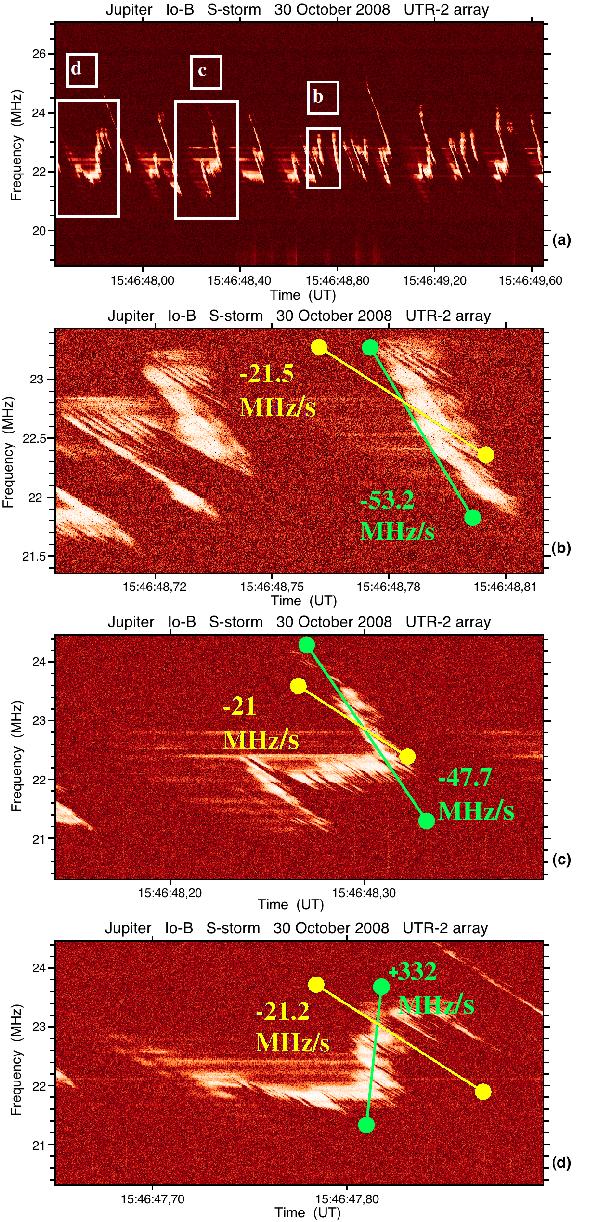
Sequence of modulated S bursts envelope (MS). a) The fragments denoted by b), c), and d) are zoomed in the corresponding panels of the figure. The remarkable feature is the presence of two apparent frequency drift rates: one for the envelope, and another one for elementary quasi linear QS bursts contained in or emerging from this envelope. The green lines in b)–d) delineate the slope of the envelope, whereas the yellow ones are drawn approximately parallel to the average slope of QS bursts inside the envelope. We note the presence of a positive drift of the envelope in d) that would be interpreted as a positively drifting S burst in a lower resolution image such as a). Resolution: 1 pixel = 16 kHz × 2 ms a), 4 kHz × 0.1 ms b), 8 kHz × 0.2 ms c), and 8 kHz × 0.2 ms d).
Current usage metrics show cumulative count of Article Views (full-text article views including HTML views, PDF and ePub downloads, according to the available data) and Abstracts Views on Vision4Press platform.
Data correspond to usage on the plateform after 2015. The current usage metrics is available 48-96 hours after online publication and is updated daily on week days.
Initial download of the metrics may take a while.