Fig. 4
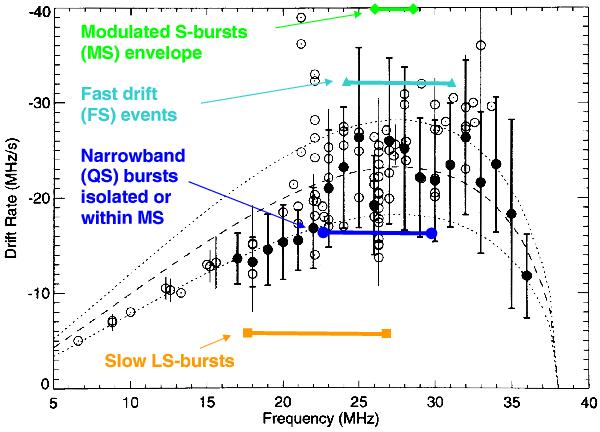
Comparison of the Ellis drift rate model for S bursts (lines) to various measurements from different research groups (open and solid circles), adapted from Fig. 2 of Zarka et al. (1997). The lines were calculated assuming adiabatically moving streams of electrons at the speed of v = 0.14c (dashed) and v = 0.14 ± 0.03c (dotted), with an equatorial pitch angle of 2.8°. We superimposed four horizontal bars indicating typical drift rates of the different types of millisecond bursts discussed in the text. From top to bottom, we find the modulated S bursts envelopes (MS bursts), the fast drift (FS) events, the simple QS bursts, and the slower LS bursts. The position of each bar was calculated as an average over measured values within a representative but arbitrarily selected dynamic spectrum of duration ~3 s. Measurements performed at other times may show considerable variability. For example, in Fig. 1c apparent QS bursts above 23.5 MHz have drift rates up to ~27 MHz/s (although it may also be a variant of MS emission).
Current usage metrics show cumulative count of Article Views (full-text article views including HTML views, PDF and ePub downloads, according to the available data) and Abstracts Views on Vision4Press platform.
Data correspond to usage on the plateform after 2015. The current usage metrics is available 48-96 hours after online publication and is updated daily on week days.
Initial download of the metrics may take a while.