Fig. 3
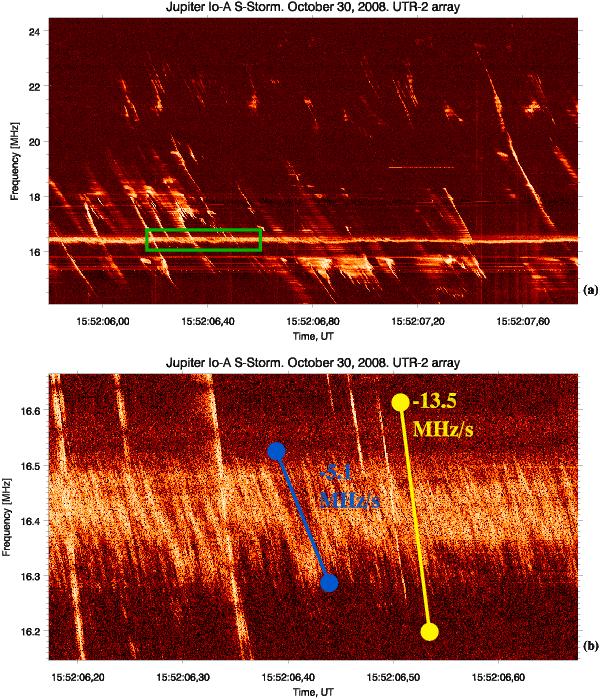
a) Narrow band of LS emission at a frequency slightly below 16.5 MHz, together with complex QS and MS bursts in the band ~14−24 MHz. b) Zoom of the apparent NB emission (inside the rectangle shown in a)) revealing LS emission. The LS structures characterized by a slow frequency drift are occasionally crossed by faster drifting QS bursts. Resolution: 1 pixel = 20 kHz × 2 ms a), and 1 kHz × 0.5 ms b). Blue and yellow segments illustrate drift rates.
Current usage metrics show cumulative count of Article Views (full-text article views including HTML views, PDF and ePub downloads, according to the available data) and Abstracts Views on Vision4Press platform.
Data correspond to usage on the plateform after 2015. The current usage metrics is available 48-96 hours after online publication and is updated daily on week days.
Initial download of the metrics may take a while.