Fig. 2
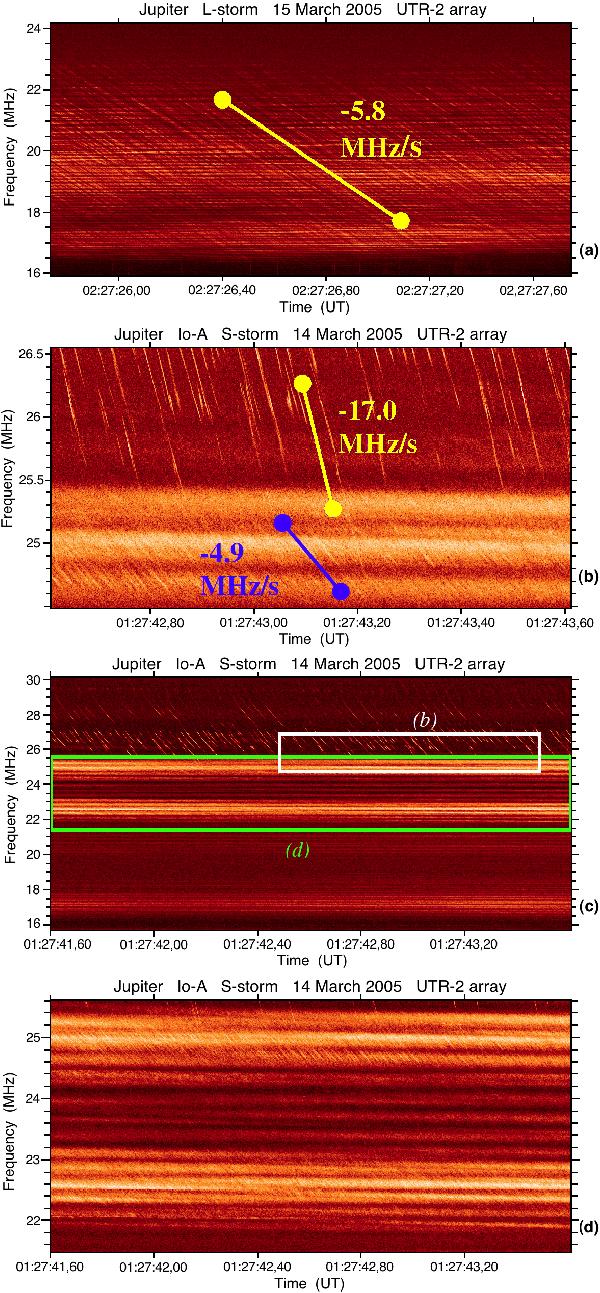
a) Wideband L emission accompanied with frequency drifting LS patterns. b) Simple quasi linear QS bursts intersecting part of the band of LS emission. For example, a deep crossing occurs around 01:27:43,20. This fragment is zoomed from the white rectangle of panel c). c) Wideband L emission accompanied by LS bursts in the band 16−25.5 MHz, simultaneous with QS bursts occurring above ~25 MHz. d) Two powerful sub-bands of LS emissions zoomed from the green rectangle in c). Resolution: 1 pixel = 16 kHz × 2 ms a), 4 kHz × 1 ms b), 28 kHz × 2 ms c), and 8 kHz × 2 ms d). The yellow and blue segments are plotted just for convenience illustrating the characteristic values of the drift rate.
Current usage metrics show cumulative count of Article Views (full-text article views including HTML views, PDF and ePub downloads, according to the available data) and Abstracts Views on Vision4Press platform.
Data correspond to usage on the plateform after 2015. The current usage metrics is available 48-96 hours after online publication and is updated daily on week days.
Initial download of the metrics may take a while.