Fig. 1
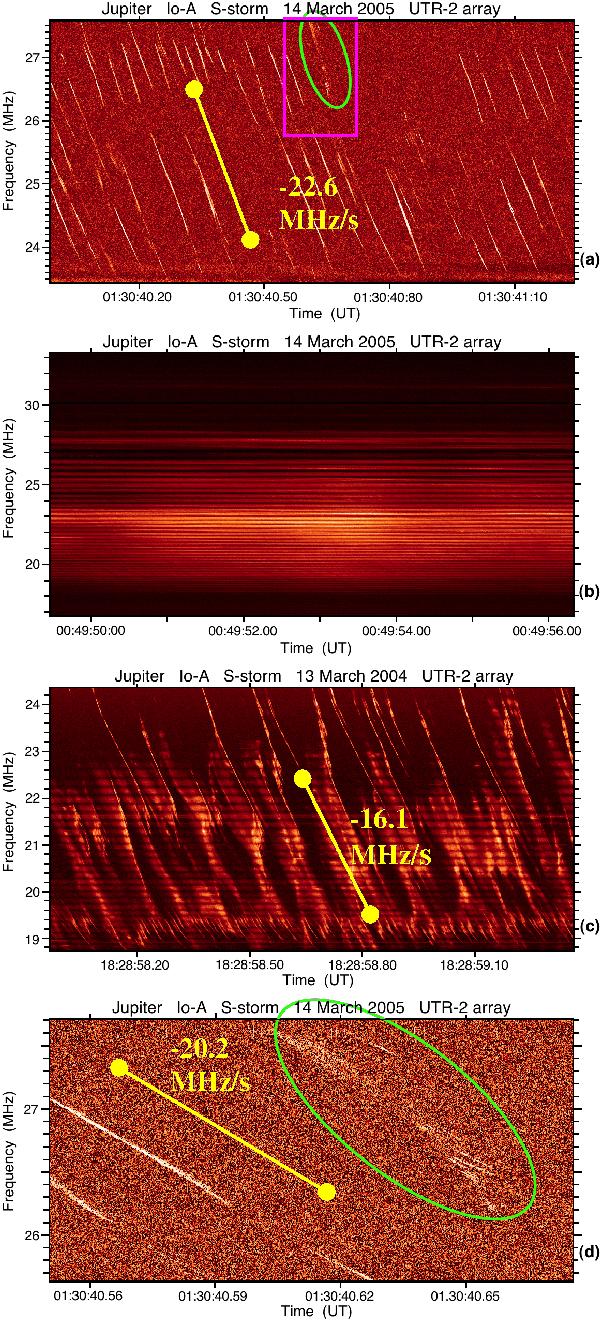
Fragments of the Jovian decametric noise storms of March 14, 2005 (a), b), d)), and March 13, 2004 c). a) Dynamic spectrum containing a sequence of simple quasi linearly drifting S burst (QS). b) Diffuse unstructured L-emission. c) Superposition of S bursts with an apparently distorted band of L emission, with a complex structure including fat bursts separated by shadow (absence of emission) zones. d) Zoomed fragment of the dynamic spectrum contained within the rectangle in a) and illustrating an envelope modulating the occurrence of simple S bursts (MS burst event) is encircled with the green ellipse. Resolution: 1 pixel = 8 kHz × 1.2 ms a), 32 kHz × 4.8 ms b), 12 kHz × 1.2 ms c), and 4 kHz × 0.12 ms d). Yellow segments are plotted just for convenience illustrating the characteristic values of the drift rate.
Current usage metrics show cumulative count of Article Views (full-text article views including HTML views, PDF and ePub downloads, according to the available data) and Abstracts Views on Vision4Press platform.
Data correspond to usage on the plateform after 2015. The current usage metrics is available 48-96 hours after online publication and is updated daily on week days.
Initial download of the metrics may take a while.