| Issue |
A&A
Volume 568, August 2014
|
|
|---|---|---|
| Article Number | A100 | |
| Number of page(s) | 4 | |
| Section | Galactic structure, stellar clusters and populations | |
| DOI | https://doi.org/10.1051/0004-6361/201423900 | |
| Published online | 29 August 2014 | |
Research Note
Miras among C stars⋆,⋆⋆
1 INAF, Osservatorio Astronomico di Roma, Viale del Parco Mellini 84, 00136 Roma, Italy
e-mail: This email address is being protected from spambots. You need JavaScript enabled to view it.
2 Département de Physique, Université de Montréal, CP 6128, Succursale Centre-Ville, Montréal, Qc, H3C 3J7, Canada
e-mail: This email address is being protected from spambots. You need JavaScript enabled to view it.
Received: 28 March 2014
Accepted: 16 July 2014
Abstract
Context. Carbon stars are among the brightest intermediate-age stars. They are seen in nearly all galaxies of the Local Group. In the Milky Way they are members of the thin disk but over a hundred have been identified in the Galactic halo. Since the halo consists essentially of an old stellar population, these carbon stars warrant special attention. We believe that such stars are trespassers and belong to streams left over by disrupted dwarf spheroidal galaxies.
Aims. By performing photometric monitoring we intend to identify Miras among the halo carbon stars.
Methods. We obtained, over several semesters, K and J images centered on the carbon stars in order to determine their variation and periodicity.
Results. We establish the variability for a number of stars and identify the Miras among them. We collect data from the literature on the Miras among various carbon star populations and show that the fraction of Miras among carbon stars is fairly constant. We demonstrate that such fractions for the halo and Sagittarius are biased because of the way targets are selected. We finally investigate the near-infrared color distribution of Miras and carbon stars.
Key words: stars: AGB and post-AGB / stars: carbon / stars: variables: general / Galaxy: halo
Based on observations made with the REM Telescope, INAF Chile.
The observed K and J magnitudes are available only at the CDS via anonymous ftp to cdsarc.u-strasbg.fr (130.79.128.5) or via http://cdsarc.u-strasbg.fr/viz-bin/qcat?J/A+A/568/A100
© ESO, 2014
1. Introduction
Galactic carbon stars (hereafter C stars) have been observed since the 19th century. They are often found to be variable, but their variability characteristics differ substantially. As stated by Whitelock et al. (1997), it is not clear if the variation is related to age, mass, metallicity, and/or mass-losing properties. Carbon stars are the brightest members of the intermediate-age population of galaxies. They have been seen in most galaxies of the Local Group (see Battinelli & Demers 2005 for a summary). In the Milky Way C stars belong to the thin disk population and they are not expected to be found among the old halo stars; however, extremely red stars have been identified (Totten & Irwin 1998) in the halo. Their follow-up (Totten et al. 2000) spectroscopy and near-infrared (NIR) photometry have revealed several variables. Subsequently, over one hundred halo C stars, selected from 2MASS colors, were spectroscopically confirmed by Mauron et al. (2004, 2005, 2007) and Mauron (2008). If our understanding of the star formation history of the Galactic halo is correct, then these stars must be alien trespassers. Some of them are faint enough to suggest that they are located at distances greater than 80 kpc from the Sun (i.e., star m11).
The discovery of variables among the halo C stars and the period determination of the Miras by Battinelli & Demers (2012, hereafter Paper I) has permitted us to establish reliable distances for a number of C stars and to compare the Miras period distribution with those of similar variables of other stellar populations. Recently Mauron et al. (2014) have determined periods for a much larger sample of halo C stars. They find that the period distribution of the halo Miras matches rather well a similar distribution for the Sgr Miras observed by Battinelli & Demers (2013), thus suggesting a probable common origin.
We present here a second set of halo C star variables discovered from a photometric monitoring. Since most of our new program stars now have periods determined by Mauron et al. (2014), we prefer here to discuss the fraction of Miras among C stars and investigate their NIR colors.
We conclude that observations in the K band are essential to properly define Miras in a uniform way. The pulsation properties of C stars in the Magellanic Clouds have been investigated, using the MACHO database (see, e.g., Raimondo et al. 2005). Unfortunately, the lack of K magnitude light curves does not allow us to correctly classify Mira among hundreds of long period variables.
2. Targets and observations
The 19 C stars selected for monitoring are listed in Table 1, which gives the ID numbers from Mauron’s lists; stars, m11 and m26 were also among the targets of Paper I. We needed more observations to establish the nature of m26 and the period of the very red variable large amplitude m11.
Paper I provides a description of the telescope and camera employed to secure the observations, the data reduction, and the magnitude calibration. Our objective was to obtain observations every ~15 days, weather permitting, during the long observing season of each target. Unfortunately, because of serious technical problems with the telescope, it was impossible to achieve our expected goal. Targets were followed during four semesters, from February 2012 to February 2014, for more than 700 days. The photometric accuracy in J and K depends on the apparent magnitudes and is discussed in Paper I.
Mean magnitudes and color of program stars.
3. Results
Table 1 gives the mean magnitudes and colors determined from the sinusoidal fits for the periodic variables. We also list the number of observations obtained for each star and the color excess calculated from Schlegel et al. (1998). Unfortunately, because of the aforementioned technical problems of REM Telescope, for some targets we have obtained very few data points.
3.1. Light variations
Figure 1 displays examples of three light variations of newly observed program stars. Star m26 has been observed for nearly three years. The additional data points of m26 confirm that it is a low amplitude variable with no sign of periodicity. It was barely variable during the last year. On the other hand, m11, presented in Fig. 2, is more interesting. The K and J variations lead to slightly different periods. This period disparity is certainly explained by the different time coverage of the J and K observations. This is a Mira star located quite far from the Sun.
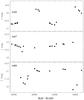 |
Fig. 1 Examples of three types of light variations: Mira, low amplitude, and irregular light curves. We note that the magnitude axis covers two magnitudes. |
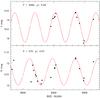 |
Fig. 2 Sine curves fitted to the K and J magnitude of m11. |
3.2. Period and classification
We search for periodicity using the J magnitudes because variables have a larger amplitude in J than in K and also because the photometric accuracy of the J magnitudes is better than the K. A simple sine curve is fitted to the data points. The quality of the fit is defined by the χ2 parameter which corresponds essentially to the mean squared deviation between the observed points and the fitted sine curve. We adopt the period yielding the smallest χ2. We are confident that the accuracy of the adopted periods is better than ± 10 days. Periods are seen to fluctuate within this range as we add a new data point. However, for a number of stars we really do not have enough data points to obtain a reliable period. Periods and classifications are given in Tab. 2; when they are available, the periods obtained by Mauron et al. (2014) are also listed under PM. We adopt their periods to calculate the distance of Miras, listed in Table 2, because the periods were determined from many more data points than ours.
We consider a Mira star as a variable star with K amplitude larger than 0.4 mag (Whitelock et al. 2006; Whitelock 2012) and periodic light curve. We allow variations in the brightness of the maxima or minima. For example one can inspect the long-range V mag variations of C stars shown by Mauron et al. (2014). Of course, definitions based on the amplitude can also be given for other pass-bands; for example, in the I-band, Soszyński et al. (2009) distinguish a Mira from a semi-regular (SR) when ΔI> 0.8 mag.
Amplitude, periods, classification, and distance.
Our definition is, however, different from the one adopted by Mauron et al. (2014). They do not have NIR observations. They base their definition of a Mira on the amplitude of the sinusoidal light curve fitted to the Catalina Sky Survey observations (Drake et al. 2009, 2013) and/or the LINEAR survey (Sesar et al. 2011, 2013) calling Miras stars those with amplitudes larger than 1.5 mag. Mauron et al. (2014) estimate that the effective wavelength of both surveys corresponds to R. This definition is unfortunately not equivalent to ours, as can be seen in Fig. 3. We have 18 stars common to their list of halo C stars. On the basis of ΔK we classify 15 stars as Miras while on the basis of ΔR, they count only 8 Miras. For example, we classify m36 as a Mira while Mauron et al. (2014) do not. For this star, Goswami’s (2005) spectral observation reveals hydrogen emission lines characteristics of Miras, thus confirming our classification. The difference between the results of the two criteria, shown in Fig. 3, has been explained by Willson & Templeton (2009). In the O-rich Miras the principal source of opacity is TiO, unlike C-rich or low metallicity Miras. A change of photospheric temperature leads to a large change in V mag for the O-rich and a small change for C-rich Miras, thus explaining why C star Miras should have smaller amplitude in the visual band.
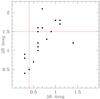 |
Fig. 3 Comparison between K and R amplitudes of variables common to the Mauron et al. (2014) survey. The red lines mark the borders of Miras according to their amplitude. |
4. Discussion
4.1. Colors of C star Miras
Most asymptotic giant branch (AGB) stars are variables and Miras represent one kind of AGB variables. The Mira phase is believed to take place during a short interval during the AGB evolution. From an observational point of view, Miras are distinguished from the SR or irregular AGB stars by two properties: a very large amplitude in the visible and a regular light curve. The large amplitude has been attributed to the variation of the molecular opacity in their upper atmosphere layers; water vapor and TiO in O-rich Miras (Ireland et al. 2008); C2 and CN are probably involved for C-rich Miras (Reid & Goldston 2002). The pulsation mechanism of Miras and SRs is probably the same. What distinguishes SRs from Miras are inhomogeneities in their upper atmosphere layers (Wittkowski et al. 2011). Clouds make the light variation irregular.
Asymptotic giant branch stars, as well as Miras, can be O-rich or C-rich. In terms of the NIR color (J − K), one generally assumes that AGB stars with (J − K) > 1.4 are C stars because O-rich M stars do not reach such red colors. Carbon stars can, however, be found with bluer colors. This color limit is not universally accepted. Survey of the literature reveals that the border between C and M stars is not very well defined. For example, Hughes & Wood (1990) found from their NIR survey of Miras with known spectral types, that 98% of O-rich stars have (J − K) < 1.6. Furthermore, observations of IRAS sources in the LMC (Wood et al. 1992; Whitelock et al. 2003) identified a number of O-rich AGBs and supergiants that are much redder than the above-mentioned limits. From observations of the 2MASS survey, Nikolaev & Weinberg (2000) set the blue limit of the C-star region at (J − K) ≈ 1.4. Cioni & Habing (2003) adopted (J − K) > 1.4 and (J − K) > 1.3 for the LMC and SMC respectively.
A compilation of the (J − K) color distributions of the C stars and Miras in a sample of Local Group galaxies shows that 70% of C stars with (J − K) > 2.0 are Miras. The number of Miras among a given C-star population should then depend on the color distribution of the C stars. Therefore, an AGB population with bluer C stars is expected to contain fewer Miras.
4.2. Miras among C stars
It has been established that the ratio of AGB stars that are C-rich and O-rich is a function of the metallicity of the stellar population (Battinelli & Demers 2005). What can we say about the number of Miras among C-star populations? This is not so straightforward because in general variable star surveys are done without taking into consideration the number of C stars in the underlying population. Furthermore, NIR surveys yield a larger number of very red stars than earlier spectroscopic observations done in the visible. To be more specific, we call C-Mira a Mira that is a C star.
We now review some examples of variable surveys where we attempt to characterize the underlying population. Cioni et al. (2001) have investigated bright variable stars in a region of the LMC. They state that the 43 Miras discovered represent 8% of the AGB stars seen in the area studied. Taking a C-rich/O-rich ratio of 0.30 for the LMC from Cioni & Habing (2003) who assume that stars above the tip of the giant branch with (J − K)>1.3 are C stars, implies that there are 124 C stars and 413 M stars among the AGB stars of the region. We cross identify the 43 Miras with the DENIS database to determine their (J − K) colors. Assuming that stars with (J − K) > 1.4 are exclusively C stars, we count a minimum of 27 C-rich and 16 O-rich stars. This yields a C-Mira/C-star ratio of less than 22% because, as we mentioned in the previous section, C stars can have colors bluer than (J − K) < 1.4.
Whitelock et al. (2013) have recently identified 51 C-Miras in a region of NGC 6822. Some of these variables have spectra taken by Kacharov et al. (2012) while the very red ones are assumed to be C stars. They have also published the photometry of all the AGB stars in their fields. We can pinpoint the C stars among these AGB stars by cross correlating their coordinates with those of the C stars identified by Letarte et al. (2002) from narrow-band photometry. We find 395 C stars among the AGB stars yielding a C-Mira/C star ratio of 13%.
Nowotny et al. (2003) surveyed the AGB population in NGC 147 and NGC 185, two galaxies that are satellites of M 31. The found, respectively, 146 and 154 C stars in the two galaxies applying the narrow-band approach based on (CN − TiO). Lorenz et al. (2011) published, a few years later, results of a variable star survey using the same telescope. They identified 18 Miras among the C stars of NGC 147 and 19 Miras in NGC 185. Since they observe in the I band, we shall call a Mira a periodic variable with a ΔI> 0.8 mag. The ratios of C-Mira among the C stars are then 12% for both galaxies.
Results of the multi-epoch study of the Fornax dwarf spheroidal galaxy by Whitelock et al. (2009) yielded five C-Miras. In the region observed there are 54 spectroscopically confirmed C stars (Westerlund et al. 1987; Lundgren 1990) thus giving a C-Mira/C star ratio of 9%. This ratio can be compared to a fraction obtained from a different approach. In the region surveyed by Whitelock et al. (2009), Demers et al. (2002) identified, from their 2MASS colors, 25 C stars. Only three of them are classified Miras yielding a ratio of 12%, but this example emphasizes the difficulty of assessing a reliable percentage. The two missing Miras, not found among the 25 C stars, are very red, (J − K) > 3.0. They were omitted from the 2MASS list because their J mag were too faint.
Menzies et al. (2010) surveyed the dwarf spheroidal galaxy Leo I to detect AGB variables. They state that in the region observed there are 26 known C stars identified by Azzopardi et al. (1986) and Demers & Battinelli (2002). Out of these 26 stars only three were found to be C-Miras. These three variables yield a ratio of 11%.
There are over 100 C stars in the Galactic halo. Before the present paper, their variability was investigated in Paper I where 13 C-Miras were identified among 24 C stars based on their K amplitude while Mauron et al. (2014) classify Miras from the R amplitude of their light curves. We have demonstrated (see Fig. 3) that the ΔR criterion underestimates the number of Miras in the sample. Therefore, adding the Miras discovered in the current paper to those of Paper I we have in the halo 23 C-Miras out of 42 C stars. For the halo the C-Mira/C star ratio is therefore 55%. This ratio can be compared to the fraction of Miras found among the C stars in the Sagittarius dwarf spheroidal galaxy. Battinelli & Demers (2013) identify 13 C-Miras among the 27 C stars, defined as stars with (J − K) > 1.4. This study yields a ratio of 48%, more than double the ratio seen in the LMC. The high percentages seen in Sagittarius and the Galactic halo are obviously overestimates because red C stars were preferentially selected for monitoring.
In summary, the C-Mira-to-C-star ratios are difficult to determine with precision because of uncertainty in the number of Miras in the field. Better optical resolution, longer sampling time andmore data points would give more Miras. Likewise the C star surveys have their limitations. Limiting magnitudes or colors have a strong influence on the final numbers. Our compilation indicates that a small fraction of C stars are Miras, this ratio is on the order of 12%.
4.3. Distances of Miras
To determine the distances of the Miras we follow the procedure described in Paper I. In Table 2, we list the estimated distances of the 11 Miras identified. The distance of m11 is ill-defined because, as seen in Fig. 2, there is an ambiguity in the period determination. For the Miras at large distances we search lists of Local Group objects to find out if they could be in the vicinity of galaxies or clusters. We find that m98 is within 3° from the direction of NGC 6822. This galaxy located at 500 kpc is much farther away. The star m42 is 2.7° from the globular cluster NGC 5634 located at 25 kpc from the Sun and therefore much closer than the Mira.
Acknowledgments
This research has made use of the NASA/IPAC Infrared Science Archive, which is operated by the Jet Propulsion Laboratory, California Institute of Technology, under contract with the National Aeronautics and Space Administration.
References
- Azzopardi, M., Lequeux, J., & Westerlund, B.E. 1986, A&A, 161, 232 [NASA ADS] [Google Scholar]
- Battinelli, P., & Demers, S. 2005, A&A, 434, 657 [NASA ADS] [CrossRef] [EDP Sciences] [Google Scholar]
- Battinelli, P., & Demers, S. 2012, A&A, 544, A10 (Paper I) [NASA ADS] [CrossRef] [EDP Sciences] [Google Scholar]
- Battinelli, P., & Demers, S. 2013, A&A, 553, A93 [NASA ADS] [CrossRef] [EDP Sciences] [Google Scholar]
- Cioni, M.-R., & Habing, H. J. 2003, A&A, 402, 133 [NASA ADS] [CrossRef] [EDP Sciences] [Google Scholar]
- Cioni, M.-R. L., Marquette, J.-B., Loup, C., et al. 2001, A&A, 377, 945 [NASA ADS] [CrossRef] [EDP Sciences] [Google Scholar]
- Demers, S., & Battinelli, P. 2002, AJ, 123, 238 [NASA ADS] [CrossRef] [Google Scholar]
- Demers, S., Dallaire, M., & Battinelli, P. 2002, AJ, 123, 3428 [NASA ADS] [CrossRef] [Google Scholar]
- Drake, A. J., Djorgovski, S. G., Mahabal, A., et al. 2009, ApJ, 696, 870 [NASA ADS] [CrossRef] [MathSciNet] [Google Scholar]
- Drake, A. J., Catelan, M., Djorgovski, S. G., et al. 2013, ApJ, 763, 32 [Google Scholar]
- Goswami, U. 2005, MNRAS, 359, 531 [NASA ADS] [CrossRef] [Google Scholar]
- Hughes, S. M. G., & Wood, P. R. 1990, AJ, 99, 784 [NASA ADS] [CrossRef] [Google Scholar]
- Ireland, M. J., Scholz, M., & Wood, P. R. 2011, MNRAS, 418, 114 [NASA ADS] [CrossRef] [Google Scholar]
- Kacharov, N., Rejkuba, M., & Cioni, M.-R. L. 2012, A&A, 537, A108 [NASA ADS] [CrossRef] [EDP Sciences] [Google Scholar]
- Letarte, B., Demers, S., Battinelli, P., & Kunkel, W. E. 2002, AJ, 123, 832 [NASA ADS] [CrossRef] [Google Scholar]
- Lorenz, D., Lebzelter, T., Nowotny, W., et al. 2011, A&A, 532, A78 [NASA ADS] [CrossRef] [EDP Sciences] [Google Scholar]
- Lundgren, K. 1990, A&A, 233, 21 [NASA ADS] [Google Scholar]
- Mauron, N. 2008, A&A, 482, 843 [Google Scholar]
- Mauron, N., Azzopardi, M., Gogoyan, K., & Kendall, T. R. 2004, A&A, 418, 77 [NASA ADS] [CrossRef] [EDP Sciences] [Google Scholar]
- Mauron, N., Kendall, T. R., & Gigoyan, K. 2005, A&A, 438, 867 [NASA ADS] [CrossRef] [EDP Sciences] [Google Scholar]
- Mauron, N., Gigoyan, K. S., & Kendal, T. R. 2007, A&A, 475, 843 [NASA ADS] [CrossRef] [EDP Sciences] [Google Scholar]
- Mauron, N., Gigoyan, K. S., Berlioz-Arhtaud, P., & Klotz, A. 2014, A&A, 562, A24 [NASA ADS] [CrossRef] [EDP Sciences] [Google Scholar]
- Menzies, J. W., Whitelock, P. A., Feast, M. W., & Matsunaga, N. 2010, MNRAS, 406, 86 [NASA ADS] [CrossRef] [Google Scholar]
- Nikolaev, S., & Weinberg, M. D. 2000, ApJ, 542, 804 [NASA ADS] [CrossRef] [Google Scholar]
- Nowotny, W., Kerschbaum, F., Olofwwon, H., & Schwarz, H. E. 2003, A&A, 403, 93 [NASA ADS] [CrossRef] [EDP Sciences] [MathSciNet] [Google Scholar]
- Raimondo, G., Cioni, M.-R. L., Rejkuba, M., & Silva, D. R. 2005, A&A, 438, 521 [NASA ADS] [CrossRef] [EDP Sciences] [Google Scholar]
- Reid, M. J., & Goldston, J. E. 2002, ApJ, 568, 931 [NASA ADS] [CrossRef] [Google Scholar]
- Schlegel, D., Finkbeiner, D., & Davis, M. 1998, ApJ, 500, 525 [NASA ADS] [CrossRef] [Google Scholar]
- Sesar, B., Stuart, J.S., Ivezić, Ž., et al. 2011, AJ, 142, 190 [NASA ADS] [CrossRef] [Google Scholar]
- Sesar, B., Ivezić, Ž., Stuart, J.S., et al. 2013, AJ, 146, 21 [NASA ADS] [CrossRef] [Google Scholar]
- Soszyński, I., Udalski, A., Szymański, M. K., et al. 2009, Acta Astrom., 59, 239 [Google Scholar]
- Totten, E. J., & Irwin, M. J. 1998, MNRAS, 294, 1 [NASA ADS] [CrossRef] [Google Scholar]
- Totten, E. J., Irwin, M. J., & Whitelock, P. A. 2000, MNRAS, 314, 630 [NASA ADS] [CrossRef] [Google Scholar]
- Westerlund, B. E., Edvardsson, B., & Lundgren, K. 1987, A&A, 178, 41 [NASA ADS] [Google Scholar]
- Whitelock, P. A. 2012, AA&SS, 341, 123 [Google Scholar]
- Whitelock, P. A., Feast, M. W., Marang, F., et al. 1997, MNRAS, 288, 512 [NASA ADS] [CrossRef] [Google Scholar]
- Whitelock, P. A., Feast, M. W., van Loon, J. Th, et al. 2003, MNRAS, 342, 86 [NASA ADS] [CrossRef] [MathSciNet] [Google Scholar]
- Whitelock, P. A., Feast, M. W., Marang, F., et al. 2006, MNRAS, 369, 751 [NASA ADS] [CrossRef] [EDP Sciences] [Google Scholar]
- Whitelock, P. A., Menzies, J. W., Feast, M. W., et al. 2009, MNRAS, 394, 795 [NASA ADS] [CrossRef] [Google Scholar]
- Whitelock, P. A., Menzies, J. W., Feast, M. W., et al. 2013, MNRAS, 428, 2216 [NASA ADS] [CrossRef] [Google Scholar]
- Willson, L. A., & Templeton, M. 2009, in Stellar Pulsation: Challenges for Theory and Observation, eds. J. A. Guzik, & P. A. Bradley, AIP conf. Proc., 1170, 113 [Google Scholar]
- Wittkowski, M., Boboltz, D. A., Irealnd, M., et al. 2011, A&A, 532, L7 [NASA ADS] [CrossRef] [EDP Sciences] [Google Scholar]
- Wood, P. R., Whiteoak, J. B., Hughes, S. M. G., et al. 1992, ApJ, 397, 582 [Google Scholar]
All Tables
All Figures
|
Fig. 1 Examples of three types of light variations: Mira, low amplitude, and irregular light curves. We note that the magnitude axis covers two magnitudes. |
| In the text | |
|
Fig. 2 Sine curves fitted to the K and J magnitude of m11. |
| In the text | |
|
Fig. 3 Comparison between K and R amplitudes of variables common to the Mauron et al. (2014) survey. The red lines mark the borders of Miras according to their amplitude. |
| In the text | |
Current usage metrics show cumulative count of Article Views (full-text article views including HTML views, PDF and ePub downloads, according to the available data) and Abstracts Views on Vision4Press platform.
Data correspond to usage on the plateform after 2015. The current usage metrics is available 48-96 hours after online publication and is updated daily on week days.
Initial download of the metrics may take a while.