Fig. 8
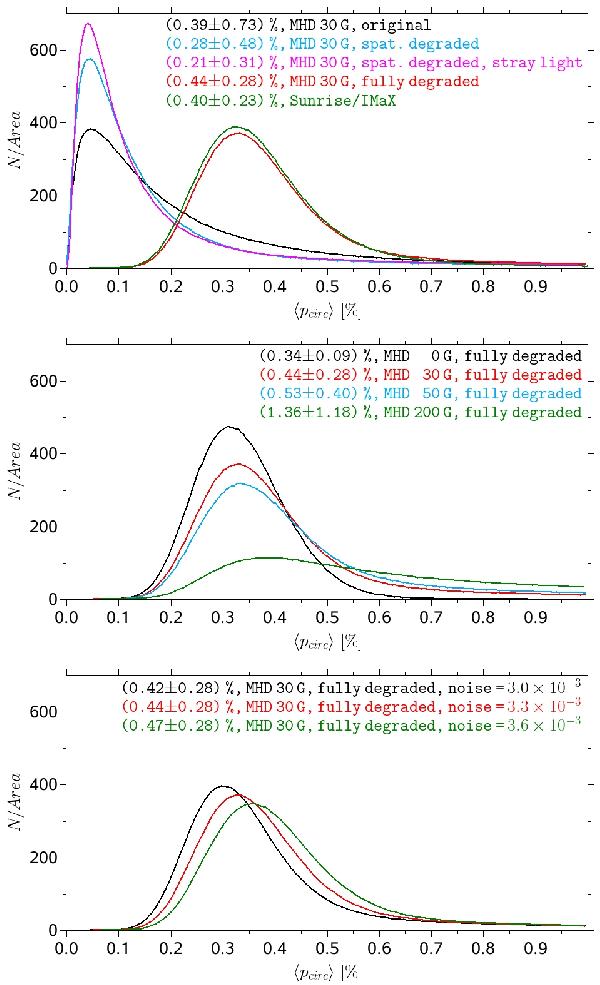
Histograms of the circular polarization degree ⟨ pcirc ⟩ as retrieved from the Stokes I and V profiles of Fe i 5250.2 Å (see Eq. (1) for definition). Top panel: the black line corresponds to the original 30 G MHD simulation, the blue line to the spatially degraded data, the magenta line represents the histogram after stray light contamination has been added. Finally, the red line corresponds to the fully degraded 30 G simulation. The green line displays the Sunrise/IMaX observations. Middle panel: influence of the MHD simulations’ mean flux density on the fully degraded polarization histogram. The black line shows a purely hydrodynamical simulation, i.e., without any magnetic field. The mean unsigned vertical flux density was 30 G for the histogram colored in red, 50 G for the blue line, and 200 G for the green line. The noise level was always 3.30 × 10⁻³IQS. Bottom panel: influence of the noise level. The flux density was always 30 G. The noise levels in units of the mean quiet-Sun intensity are printed as text labels.
Current usage metrics show cumulative count of Article Views (full-text article views including HTML views, PDF and ePub downloads, according to the available data) and Abstracts Views on Vision4Press platform.
Data correspond to usage on the plateform after 2015. The current usage metrics is available 48-96 hours after online publication and is updated daily on week days.
Initial download of the metrics may take a while.