Fig. 7
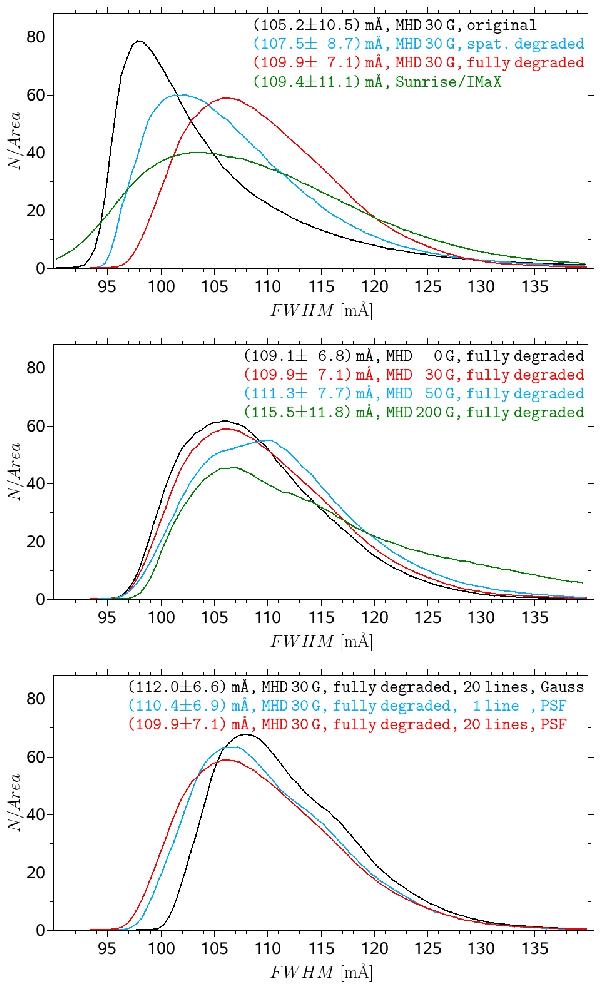
Top and middle panels: same as Fig. 3, but for the spectral line width (FWHM) as retrieved from a Gaussian fit to the Stokes I profiles of Fe i 5250.2 Å. Bottom panel: influence of different approximations made during the spectral synthesis of the 30 G MHD data on the histogram of the spectral line width. The spectra were fully degraded in all three plotted cases. The black line corresponds to the histogram obtained when the filter transmission profile was approximated by an 85 mÅ Gaussian instead of the measured spectral PSF. The blue line corresponds to a spectral synthesis of only the 5250.2 Å line, i.e., the 19 neighboring lines were not synthesized. For comparison, the red line in the top panel is plotted again and corresponds to the 20-line synthesis and spectral degradation with the measured spectral PSF.
Current usage metrics show cumulative count of Article Views (full-text article views including HTML views, PDF and ePub downloads, according to the available data) and Abstracts Views on Vision4Press platform.
Data correspond to usage on the plateform after 2015. The current usage metrics is available 48-96 hours after online publication and is updated daily on week days.
Initial download of the metrics may take a while.