Fig. 3
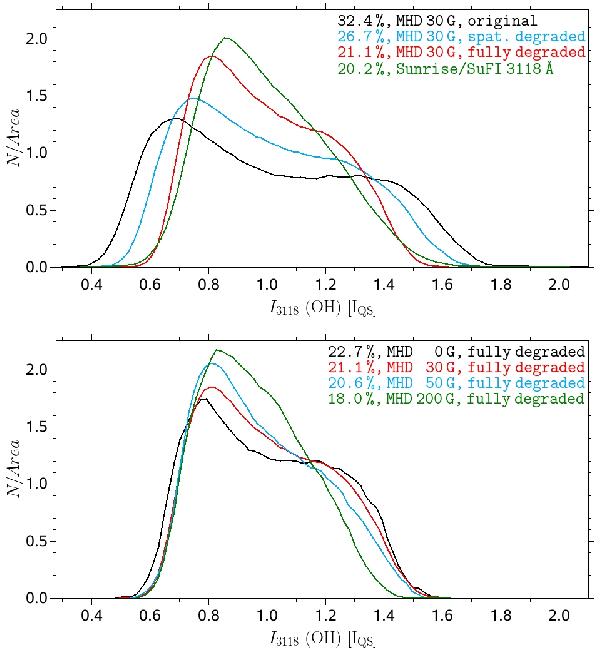
Intensity histograms over all pixels for the OH band data around 3118 Å. Top panel: the black line corresponds to the original 30 G MHD simulation, the blue line to the spatially degraded data, and the red line to the fully degraded simulation data. The green line displays the Sunrise observations. Bottom panel: influence of the MHD simulations’ mean flux density on the fully degraded OH intensity histogram. The black line shows a purely hydrodynamical simulation, i.e., without any magnetic field. The mean unsigned vertical flux density was 30 G for the histogram colored in red, 50 G for the blue line, and 200 G for the green line. rms contrasts are indicated in the text labels.
Current usage metrics show cumulative count of Article Views (full-text article views including HTML views, PDF and ePub downloads, according to the available data) and Abstracts Views on Vision4Press platform.
Data correspond to usage on the plateform after 2015. The current usage metrics is available 48-96 hours after online publication and is updated daily on week days.
Initial download of the metrics may take a while.