Fig. 23
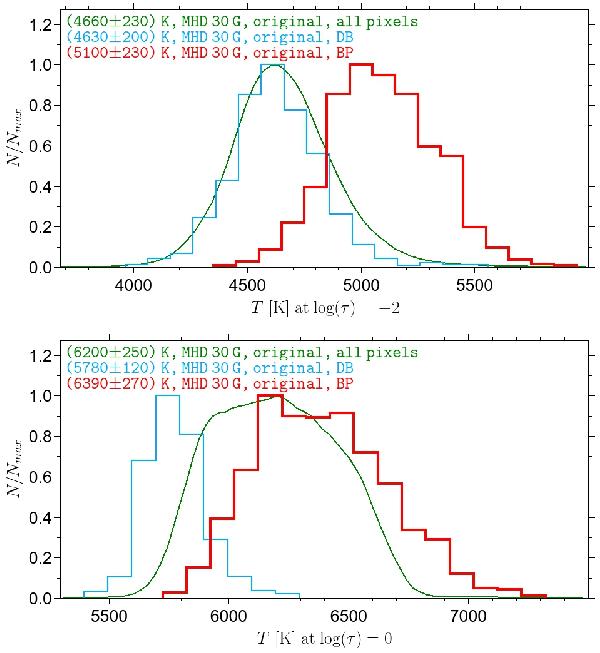
Temperature for the simulated BPs (red lines), for the BPs’ dark background (blue lines), and for all pixels in all frames (green lines). Mean values and their standard deviations are given in the text labels. The top panel shows the temperature at log(τ) = −2 and the bottom panel at optical depth unity (the T scales are different).
Current usage metrics show cumulative count of Article Views (full-text article views including HTML views, PDF and ePub downloads, according to the available data) and Abstracts Views on Vision4Press platform.
Data correspond to usage on the plateform after 2015. The current usage metrics is available 48-96 hours after online publication and is updated daily on week days.
Initial download of the metrics may take a while.