Fig. 2
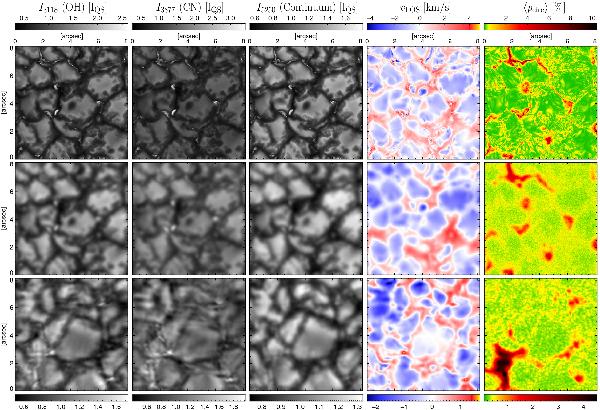
Intensity maps in the wavelength bands 3118 Å and 3877 Å, as well as for the continuum at 5250.4 Å (first three columns), all normalized to the corresponding mean quiet-Sun intensity level, IQS. The LOS velocity (positive velocities correspond to downflows) and the circular polarization degree (see main text for definition) are shown in Cols. 4 and 5, respectively. The color bars at the top refer to the undegraded MHD data shown in the first row, while the lower color bars apply to the degraded MHD data (second row) and to the data obtained from the Sunrise Observatory (third row).
Current usage metrics show cumulative count of Article Views (full-text article views including HTML views, PDF and ePub downloads, according to the available data) and Abstracts Views on Vision4Press platform.
Data correspond to usage on the plateform after 2015. The current usage metrics is available 48-96 hours after online publication and is updated daily on week days.
Initial download of the metrics may take a while.