Fig. 18
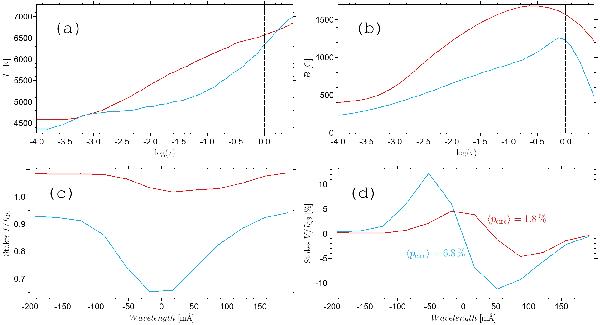
Demonstration of a weak polarization signal owing to the strong temperature sensitivity of the Fe i line at 5250.2 Å by a comparison of a pixel in a particularly bright BP (red lines) with a pixel located in a much less bright BP (blue lines). a) Vertical temperature stratification as a function of log(τ) at 5000 Å. b) Magnetic field strength stratification. c) and d) Stokes I/IQS and V/IQS signals from the original MHD data at the twelve IMaX L12-2 scan positions in the line.
Current usage metrics show cumulative count of Article Views (full-text article views including HTML views, PDF and ePub downloads, according to the available data) and Abstracts Views on Vision4Press platform.
Data correspond to usage on the plateform after 2015. The current usage metrics is available 48-96 hours after online publication and is updated daily on week days.
Initial download of the metrics may take a while.