Fig. 17
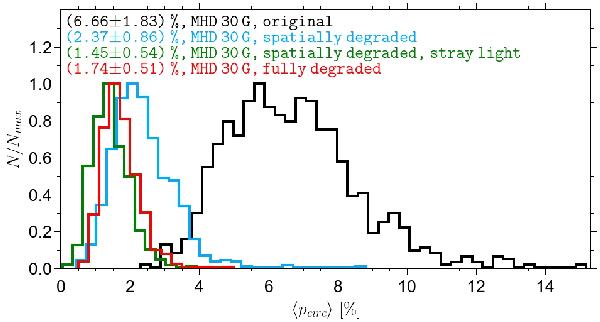
Influence of the various degradation steps on the histogram of the BP circular polarization degree. The degradation was applied to the 30 G MHD simulations. The black line corresponds to the data that were only spectrally degraded. An additional spatial degradation results in the blue histogram. The green line also includes the effect of stray light contamination, while the fully degraded BP signals, i.e., including noise, give the histogram colored in red.
Current usage metrics show cumulative count of Article Views (full-text article views including HTML views, PDF and ePub downloads, according to the available data) and Abstracts Views on Vision4Press platform.
Data correspond to usage on the plateform after 2015. The current usage metrics is available 48-96 hours after online publication and is updated daily on week days.
Initial download of the metrics may take a while.